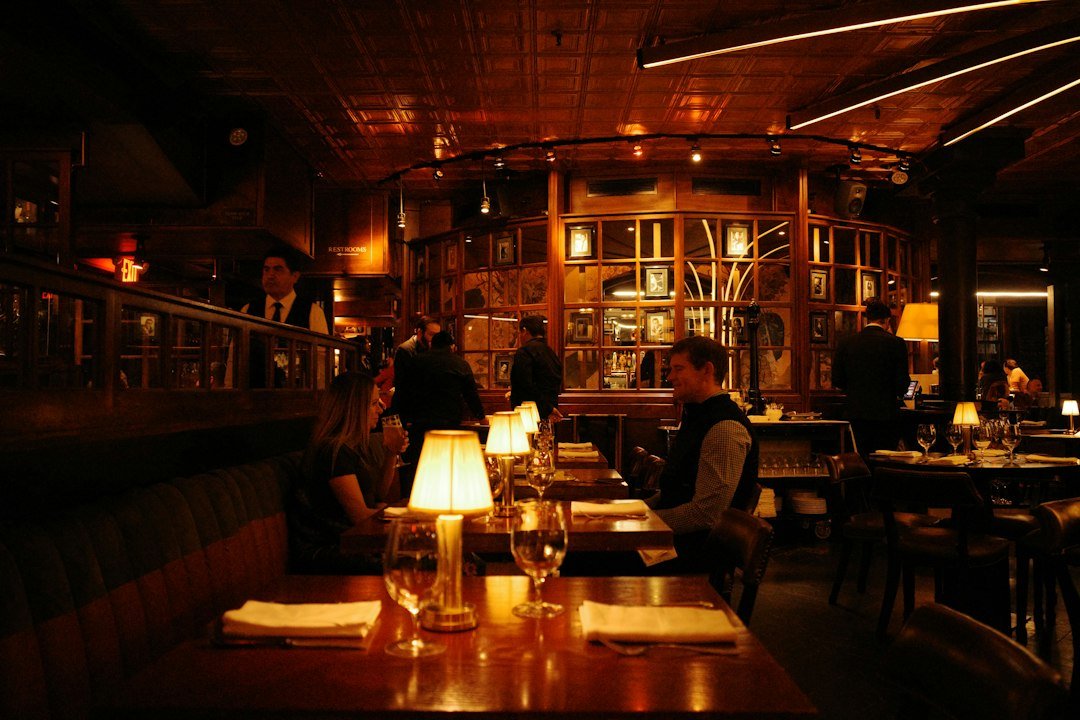
Restaurant table turn time is often treated as a speed problem. That is usually a mistake.
A dining room does not become more productive simply because guests leave faster. The real goal is to remove avoidable waiting inside the service journey while protecting hospitality, food quality and guest comfort.
That means measuring where time is being lost, understanding which bottlenecks are actually constraining capacity, and improving the handoffs between the host stand, service team, kitchen, payment and table reset.
What table turn time actually measures
Table turn time is the elapsed time from when a party is seated until the table is available for the next party.
A simple formula is:
Average table turn time = Total occupied table minutes ÷ Number of completed parties
Illustrative example:
- 20 completed parties
- 1,760 total occupied minutes
1,760 ÷ 20 = 88 minutes average turn time
The number is useful, but it should never be read in isolation.
Do not compare unlike parties
A two-top at lunch and an eight-person birthday dinner are not the same service pattern.
Break turn time down by:
- daypart,
- party size,
- weekday versus weekend,
- reservation versus walk-in,
- menu format,
- service style,
- special events.
A blended average can hide the real operating issue.
Measure the service journey, not just the final number
If average turn time is 95 minutes, management still needs to know where those 95 minutes are being spent.
Useful checkpoints include:
- seated to first greeting,
- greeting to drink order,
- drink order to food order,
- food order to first course,
- first course to main course,
- meal completion to check presentation,
- check presentation to payment,
- guest departure to reset complete.
This turns a vague speed problem into a process map.
Find the real bottleneck
Suppose a restaurant wants to reduce average turn time by ten minutes.
If the kitchen is already delivering main courses within standard but payment routinely takes twelve minutes, pushing cooks harder will not solve the constraint.
Likewise, faster payment does not matter if dirty tables sit for nine minutes before reset.
The bottleneck is the stage that most consistently prevents the next useful action.
Start with the host stand
Poor seating pace can create service problems that look like kitchen or labor problems later.
If six tables are seated within five minutes, the restaurant may create a wave of:
- drink orders,
- appetizer tickets,
- main-course tickets,
- payment requests,
- table resets.
Staggering arrivals can smooth demand through the whole operation.
Use reservation spacing intentionally
Reservation slots should reflect the restaurant’s real service capacity, not just the number of empty tables.
Consider:
- party-size mix,
- server section capacity,
- kitchen production peaks,
- bar capacity,
- table combinations,
- expected turn patterns.
Eight reservations at 7:00 p.m. may be harder to serve than four at 6:50 and four at 7:10, even if the total guest count is identical.
Do not seat the room faster than the operation can absorb it
An empty table is not always immediately available capacity.
If a server has just received three new tables, the next table may experience a poor greeting and delayed order even though another table is physically open.
The host should understand section load, not just table availability.
Track covers as well as tables
Table count alone can mislead.
A dining room with 20 tables may serve very different guest volumes depending on the mix of two-tops, four-tops and larger parties.
For capacity planning, track:
- tables served,
- covers served,
- average party size,
- occupied seat count,
- unused seats at occupied tables.
Calculate table turns carefully
A practical meal-period measure is:
Table turns = Parties served ÷ Tables available
Illustrative example:
- 40 parties served during dinner
- 20 tables available
40 ÷ 20 = 2.0 table turns
This does not mean every individual table turned exactly twice. Some may turn three times and others once.
Translate table turns into approximate cover capacity
If the restaurant has 20 tables, expects 2.0 turns and has an average party size of 2.5 guests:
20 × 2.0 × 2.5 = approximately 100 covers
This is a planning estimate, not a guarantee. Real capacity depends on table mix, reservation timing and service flow.
First greeting time is a small metric with a large effect
A table that waits too long for acknowledgement starts the entire journey behind schedule.
The first greeting does not need to include a full sales conversation. It should establish contact and begin the service sequence.
During peak periods, managers should watch for newly seated tables that have not been acknowledged.
Reduce ordering friction
Guests often need time to choose. The goal is not to rush that decision.
But avoidable ordering friction can be reduced through:
- clear menus,
- accurate availability information,
- staff menu knowledge,
- fast answers about ingredients and modifiers,
- logical POS modifier screens,
- prompt drink service.
A confused menu or poorly trained server increases service time without improving the guest experience.
Menu complexity can affect dining-room throughput
A menu item that creates an unusually long kitchen ticket time can influence table availability during peak periods.
Review whether slow items are:
- priced appropriately,
- prepped correctly,
- sequenced well,
- causing station bottlenecks,
- ordered heavily at the same time.
Do not remove profitable or distinctive items simply because they are slower. Understand the operational cost before making a decision.
Kitchen pacing matters more than raw speed
A kitchen that fires everything immediately can overload stations and create inconsistent ticket times.
Better pacing means controlling the sequence of work so the kitchen can produce predictable output.
Consistency is often more useful to the dining room than occasional very fast tickets mixed with long delays.
Watch course gaps
In multi-course service, long dead time between courses can extend table occupancy without adding hospitality value.
Track whether the delay comes from:
- late firing,
- kitchen queue,
- server communication,
- table clearing,
- guest pacing.
Guest pacing should be respected. Operational delay should be fixed.
Do not confuse dining pace with kitchen ticket time
A fast kitchen does not automatically create a fast table turn.
Guests may still wait for:
- drinks,
- server attention,
- dessert menus,
- the check,
- payment processing.
Table turn is a full-system metric.
Check presentation is often an avoidable delay
Once guests clearly indicate they are finished, long waits for the check add little value.
Managers should observe:
- how quickly servers recognize meal completion,
- whether bills can be prepared efficiently,
- whether split checks create unnecessary delays,
- whether the POS workflow is slowing settlement.
Payment can become the final bottleneck
A guest ready to leave should not wait ten minutes because the payment device is unavailable.
Common causes include:
- too few payment terminals,
- slow card processing,
- server congestion,
- poor split-payment workflow,
- manual approvals,
- printer problems.
Measure payment time before buying more hardware. Confirm that the equipment is actually the constraint.
Do not remove dessert or coffee just to improve turn time
A shorter table turn can reduce revenue if the restaurant sacrifices profitable final-course sales.
The correct question is not:
How do we get the table back faster?
It is:
How do we remove unproductive waiting while preserving profitable, wanted service?
Measure revenue per available seat hour
One useful dining-room productivity metric is revenue per available seat hour.
Revenue per available seat hour = Dining-room revenue ÷ Available seat hours
Illustrative example:
- 80 seats
- 5-hour dinner period
- $12,000 dining-room revenue
Available seat hours:
80 × 5 = 400 seat hours
Revenue per available seat hour:
$12,000 ÷ 400 = $30
This gives management a broader view than turn time alone because it includes both occupancy and spending.
Do not optimize one metric at the expense of another
If turn time improves but average check falls sharply, guest complaints increase and return visits decline, the restaurant may have damaged the business.
Review turn time alongside:
- average check,
- guest complaints,
- review trends,
- repeat business where measurable,
- sales per labor hour,
- table utilization.
Our Restaurant Labor Forecasting guide explains how expected demand should influence staffing coverage.
Table reset time deserves its own standard
A party leaves, but the table is not productive again until it is clean, reset and released to the host.
Track:
- guest departure time,
- bus start time,
- clean complete time,
- reset complete time,
- host notification time.
A five-minute reset delay across ten peak-period tables can remove meaningful seating capacity.
Design the reset process
Define who does what.
A clear reset standard may specify:
- who removes glassware,
- who clears plates,
- who sanitizes the table,
- who replaces settings,
- who tells the host the table is ready.
Ambiguity creates waiting between steps.
Stage reset supplies before the rush
Table turns slow down when staff must search for:
- cutlery,
- napkins,
- clean glasses,
- condiments,
- menus,
- sanitation supplies.
Pre-shift readiness reduces reset friction.
Use the Restaurant Pre-Shift Meeting to communicate expected volume, large parties, menu outages and service priorities before doors open.
Section design affects table flow
Server sections should be balanced by workload, not just table count.
Five two-tops and five large tables do not represent the same service load.
Consider:
- seat count,
- table size,
- distance from service stations,
- reservation timing,
- server experience.
Use support roles where they remove a real constraint
Food runners, bussers, hosts or server assistants can improve flow, but only if they remove work from the stage that is actually constrained.
Adding a runner does little if the real delay is payment processing.
Adding a busser may have strong impact if clean tables regularly sit unavailable during the waitlist peak.
Do not use average turn time as a disciplinary weapon
Servers cannot fully control:
- kitchen delays,
- guest conversation,
- large-party behavior,
- payment-system outages,
- reservation waves.
Use the metric to diagnose systems first.
Track by party-size band
A useful structure might be:
| Party size | Average turn | Primary issue |
|---|---|---|
| 1–2 | 72 min | Payment delay |
| 3–4 | 88 min | Main-course ticket time |
| 5–6 | 108 min | Ordering and split checks |
| 7+ | 142 min | Course pacing |
All figures above are illustrative.
This view is more actionable than a single blended average.
Compare peak and non-peak periods
If turn time is normal at 5:30 p.m. and deteriorates sharply at 7:30 p.m., the issue is probably capacity-related rather than a basic service-procedure problem.
That may point to:
- staffing,
- kitchen capacity,
- reservation concentration,
- bar congestion,
- reset capacity.
Use waitlist accuracy as a control metric
Guests become frustrated when quoted wait times are repeatedly wrong.
The host team should compare quoted wait with actual seating time.
Large errors may indicate that the restaurant’s assumptions about table turns are unrealistic.
Do not promise a table based only on historical averages
If the average table turns in 85 minutes, that does not mean a specific table will be free in exactly 85 minutes.
The host should consider:
- where the current party is in its meal,
- whether dessert has been ordered,
- party size,
- payment status,
- reset time.
Look for the twenty-minute dead zone
Many restaurants discover that the biggest opportunity is not throughout the meal. It is one dead zone.
Examples:
- eight minutes before first greeting,
- twelve minutes waiting for drinks,
- fifteen minutes between courses,
- ten minutes waiting to pay,
- seven minutes for table reset.
Removing one dead zone can improve capacity without changing the hospitality experience at all.
Review table-turn exceptions in the manager log
If flow breaks down because of an unusual event, record the cause.
Examples:
- dishwasher failure slowed resets,
- POS outage delayed payment,
- large walk-in group overloaded one section,
- menu item outage caused re-ordering,
- unexpected staff absence reduced coverage.
The Restaurant Manager Logbook can preserve that context for the next shift and for weekly review.
Build a seven-day baseline before changing targets
Before setting a new standard, collect enough operating data to understand normal variation.
For at least one representative week, record:
- turn time by party size,
- covers by half-hour,
- ticket time,
- payment time,
- reset time,
- guest complaints linked to pacing.
Then identify which stage has the clearest avoidable delay.
Set targets as ranges, not fantasy numbers
A target should reflect the restaurant’s concept.
A quick-service lunch operation, casual family restaurant and tasting-menu venue should not share the same expectation.
Use a realistic range by service style and party size.
Do not impose an arbitrary industry number without measuring your own operation.
Coach behaviors, not just results
Instead of telling staff to “turn tables faster,” coach observable behaviors:
- acknowledge new tables promptly,
- know the menu well enough to answer questions,
- fire courses correctly,
- pre-bus when appropriate,
- recognize when guests are ready for the check,
- process payment without avoidable waiting,
- release reset tables to the host immediately.
These behaviors improve flow without encouraging staff to pressure guests.
Monitor guest signals
Do not force a fixed pace onto every table.
Some guests are clearly in a hurry. Others are celebrating, meeting friends or conducting business.
Good service adapts within the restaurant’s operating model.
Use demand to decide when table-turn improvement matters most
Reducing turn time has little revenue value when half the dining room is empty.
It matters most when:
- there is a real waitlist,
- reservations are constrained,
- peak demand exceeds seating capacity,
- lost parties are measurable.
This prevents management from chasing speed during periods when capacity is not the problem.
Estimate the value of recovered capacity
Illustrative example:
- 10 peak-period tables affected
- one additional usable seating opportunity recovered across the group
- average party size 2.5
- average check $32 per guest
Potential additional sales:
2.5 × $32 = $80
If the change reliably creates several additional seatings across the peak, the value can become material.
But this calculation only matters if demand exists. Empty capacity cannot be monetized by faster turns.
Review table flow with the daily sales report
Sales data can help determine whether improved flow is producing better results.
Compare:
- covers,
- sales,
- average check,
- peak-hour throughput,
- labor productivity.
Use the Restaurant Daily Sales Report as the financial counterpart to the service-flow review.
A practical table-turn improvement routine
- Measure current turn time by party size and daypart.
- Break the journey into service stages.
- Identify the largest avoidable delay.
- Choose one process change.
- Train the responsible role.
- Measure for one week.
- Check guest feedback and average check.
- Keep the change only if overall performance improves.
The goal is smoother flow, not faster guests
The best dining-room operations do not make guests feel processed.
They remove friction guests never wanted in the first place: waiting to be greeted, waiting for a course that should already be moving, waiting for the check, waiting to pay, and watching an empty dirty table sit unavailable while a queue grows at the door.
Table turn time is useful because it exposes those delays.
Used correctly, it improves capacity and hospitality at the same time.
Use median turn time alongside the average
Average turn time can be distorted by a few very long tables. Median turn time shows the middle completed party and can make normal operating performance easier to see.
Review average, median and the slowest meaningful outliers together. A wide gap between average and median often signals a small number of severe delays rather than a system-wide problem.
Build a stage-time dashboard
| Stage | Measure | Owner |
|---|---|---|
| Seat to greet | Minutes | Server / host |
| Order to main | Minutes | Kitchen + service |
| Meal end to check | Minutes | Server |
| Payment | Minutes | Server / POS |
| Departure to reset | Minutes | Bus / host |
This keeps management focused on the stage creating delay instead of pressuring the entire team to “go faster.”
Frequently asked questions
What is a good restaurant table turn time?
There is no universal target. It depends on concept, party size, menu, service style and guest occasion. Build targets from your own baseline and demand pattern.
Should restaurants try to shorten every table?
No. Focus on avoidable waiting. Guest-led dining time and profitable dessert or beverage occasions should not be cut simply to improve a speed metric.
When does faster table turning create financial value?
Mainly when real demand exceeds available seating. Faster turns during an empty period do not create additional sales capacity.
Operational note: All calculations and examples in this guide are illustrative. Appropriate turn-time expectations vary by restaurant concept, menu, service style, party size and guest occasion.