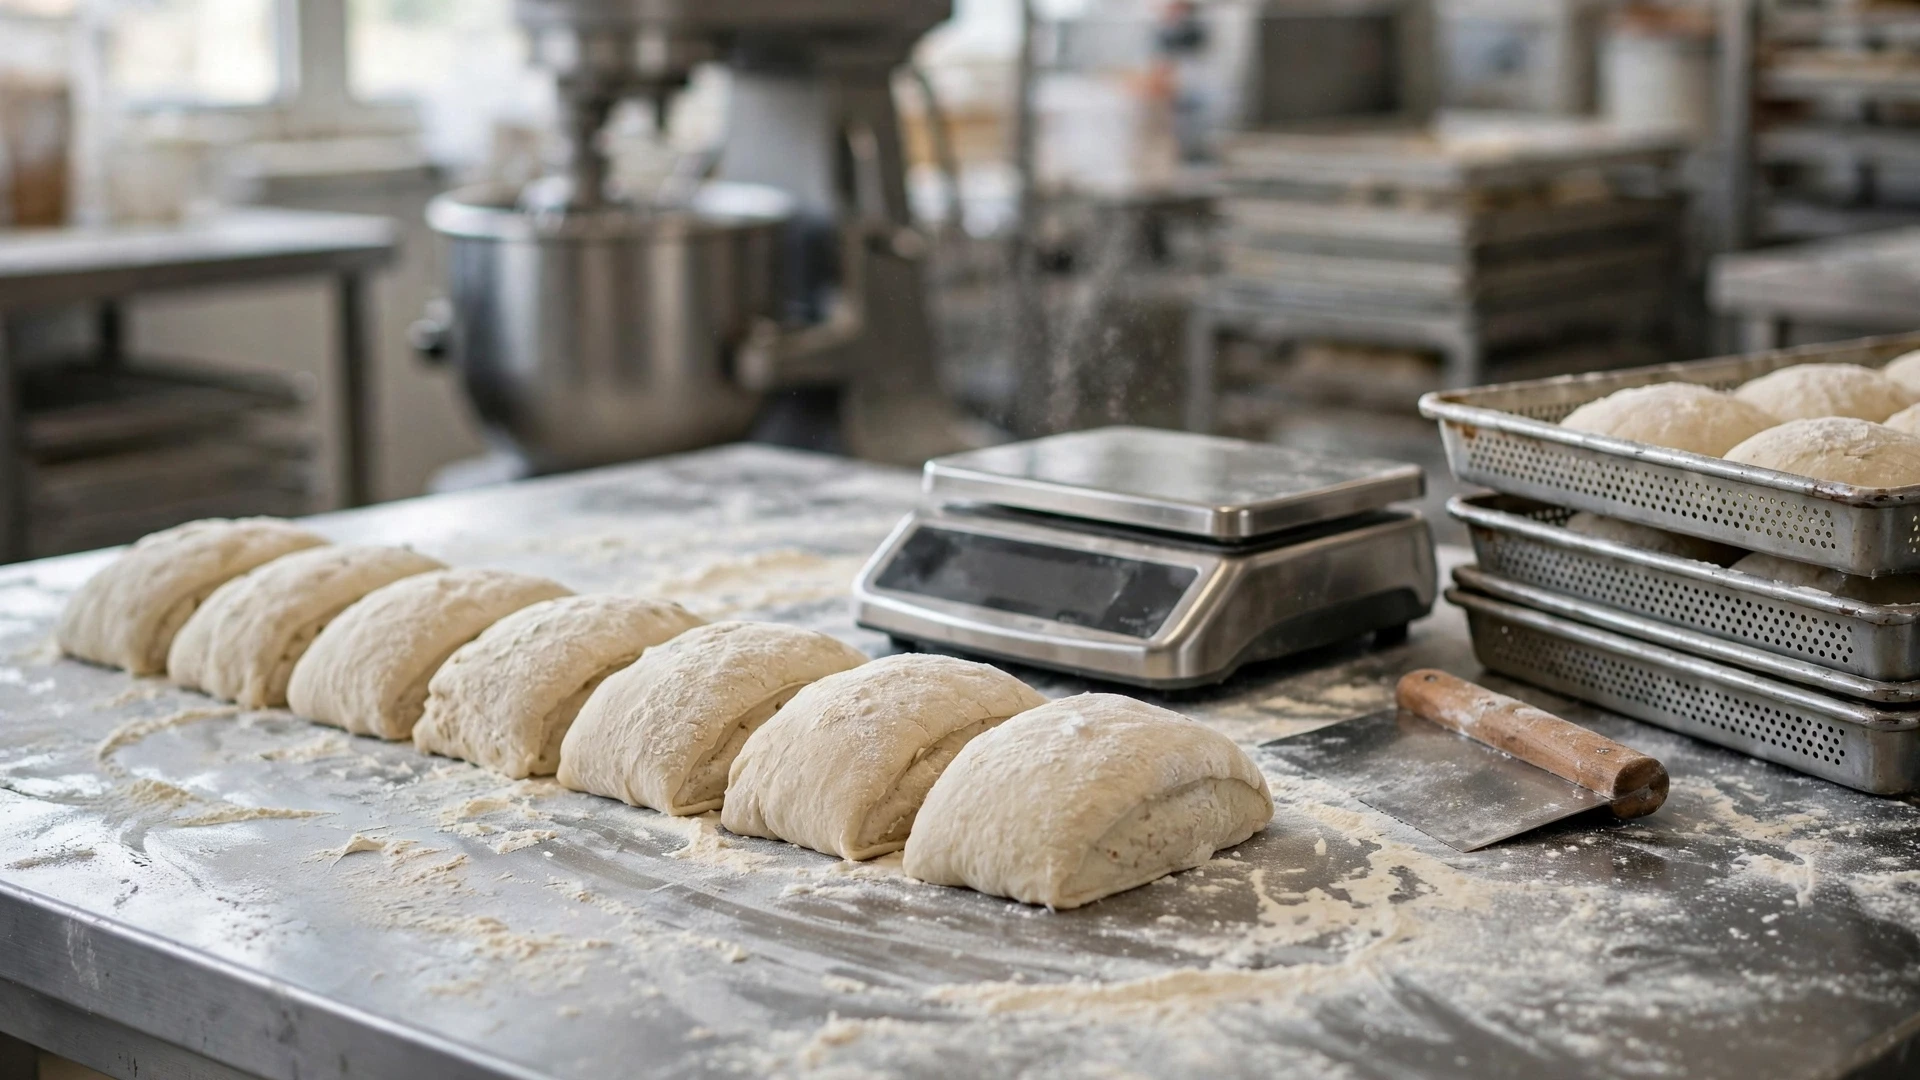
Consistency starts at the scale
For bread, rolls, buns, pizza dough and many pastry products, piece weight influences proofing, bake time, finished size, cost and customer perception. Dough scaling control gives production a measurable standard before variability becomes visible in the oven. The purpose is not to chase a perfect gram for every rustic product; it is to keep normal variation inside a range that protects yield and product specification.
The standard should define whether target weight is pre-proof, pre-bake or finished weight. Mixing those stages makes the tolerance meaningless.
Set target piece weight from finished specification
Work backward from the product. Define the desired finished size or portion, test normal baking loss, and set the raw dough weight that reliably produces it. If recipe yield changes, the target piece weight may stay the same while the number of portions changes.
Document the target and tolerance by SKU. A dinner roll, burger bun and artisan loaf need different practical tolerances.
Calibrate and position the scale
A production scale should be on a stable surface, suitable for the weight range and checked according to site procedure. Confirm zero/tare behavior before the run and avoid drafts, vibration or overloaded platforms that make readings inconsistent. If multiple scales are used, compare them periodically.
A scale that is technically accurate but placed far from the divider encourages staff to estimate by feel during busy production. Workflow design affects compliance.
Control the divider and cutting method
Manual cutting introduces a different error pattern from mechanical dividing. For manual work, train staff to cut slightly under target and add rather than repeatedly trimming large pieces. For mechanical dividers, verify total batch weight, piece count and machine settings; an incorrect batch weight can make every piece consistently wrong.
Record the first several pieces after setup and recheck after a dough or machine change.
Dough condition affects scaling behavior
Hydration, fermentation, temperature and handling can change stickiness and the ease of dividing cleanly. If staff add bench flour inconsistently or lose dough to equipment, theoretical yield and actual piece count diverge. Standardize the handling method enough that weight loss is not hidden in the process.
For enriched or filled products, decide whether inclusions are part of the target weight and keep that definition consistent.
Use a sampling plan instead of weighing forever
Not every operation needs every piece weighed after the process is stable. A practical control may weigh the first 10 pieces, then a sample from each tray or at defined intervals. Increase sampling when the dough, operator, divider or target changes.
Set action rules for out-of-tolerance samples: adjust technique or equipment, recheck a larger sample, and decide whether affected pieces can be corrected before proofing.
Connect piece weight to batch yield
Expected portions = total usable dough weight / target piece weight. Compare expected portions with actual pieces plus documented scrap or rework. If the batch should produce 120 buns but produces 114 at the correct weight, dough is being lost somewhere. If it produces 126, average pieces may be underweight.
This simple reconciliation links portion control to bakery yield and waste control.
Example: apparently small overweight becomes a batch loss
A bun target is 90 g, but the production average is 95 g. On 300 buns, that extra 5 g uses 1.5 kg of dough—more than sixteen additional standard buns. The issue may not be visible to the guest, but it affects yield and food cost every batch.
The numbers are illustrative. Use the actual target, tolerance and batch volume for your product.
Scaling control sheet
- SKU and dough batch.
- Target piece weight and tolerance.
- Scale ID/check.
- Divider or manual method.
- First-piece sample results.
- Mid-run sample.
- Expected portions vs actual count.
- Scrap/rework note.
- Operator and corrective action.
Common errors
- Using finished weight as the scaling target without accounting for bake loss.
- Allowing each baker to choose a personal “feel” for size.
- Checking average weight but ignoring a very wide spread.
- Changing hydration or handling without rechecking the process.
- Failing to reconcile total batch weight with piece count.
- Using a scale that is awkwardly positioned so production bypasses it.
FAQ
Q: What is a good tolerance? A: It depends on the product, customer specification and process capability; establish a practical range through testing.
Q: Should every piece be weighed? A: Not necessarily; use full weighing during setup/training and a defined sampling plan once the process is capable.
Q: Does proofing change the weight target? A: Proofing changes volume more than mass; define the target stage and keep it consistent.
Q: What if the divider is always off? A: Verify batch weight, machine setup and maintenance before compensating with informal manual corrections.
Next action
Select one high-volume dough SKU. Confirm its tested raw piece target, weigh the first ten pieces from the next three batches and calculate both average and spread. Then reconcile total batch weight with actual piece count. The result will show whether the primary problem is scaling technique, divider setup or upstream yield.
Use statistical thinking without making the process academic
Average piece weight can hide a wide spread. Record minimum and maximum, or at least the number of samples outside tolerance. A batch averaging exactly 90 g is still uncontrolled if half the pieces are 80 g and half are 100 g.
The practical target is process capability: most pieces should land inside the chosen specification without constant rework. When spread widens, investigate technique, equipment or dough condition.
Link scaling variance to bake performance
Underweight and overweight pieces often bake differently. Track whether out-of-tolerance dough also creates color, crumb, moisture or finished-size variation. This helps the bakery choose a tolerance that reflects product quality rather than an arbitrary number.
If scaling is consistent but finished size varies, the root cause may be proofing, shaping, oven loading or formulation rather than the scale.
Additional operating detail
Training should include scale technique, not just the target number. Show how to tare correctly, where to place the dough, how to avoid leaning on the bench and how to handle sticky pieces without adding uncontrolled flour. Small technique differences can create systematic bias even when employees are using the same scale.
Finished-product audits should occasionally trace back to scaling records. If a tray of buns shows unusual size variation, compare the batch’s piece-weight samples, proofing conditions and oven load. This prevents the bakery from blaming scaling for every finished-size problem and helps locate the stage where variation actually entered the process.
Manager implementation notes
Scaling data becomes more useful when tied to ingredient cost. Calculate the cost of average overweight for high-volume products: excess grams per piece multiplied by pieces produced and dough cost per gram. This converts an apparently minor portion issue into a weekly or monthly financial number and helps managers decide whether more training or equipment attention is justified.
When the bakery changes flour, hydration, mixer, divider or proofing process, temporarily tighten observation even if the nominal target weight stays the same. Process changes can affect sticking, scrap and handling behavior. Document the change date so any shift in scaling spread can be traced to a real production change instead of being blamed on the operator by default.
Further operating guidance
Create a visual reference for finished size only after the weight standard is stable. Photos, sample pieces or ring gauges can help staff notice obvious variation, but they should support the scale rather than replace it. Visual cues are especially useful during shaping, when two pieces of equal weight can still look different because tension or geometry varies.
If the product is packed or sold by count, scaling consistency also affects packaging. Oversized pieces can prevent the standard count from fitting a tray or bag; undersized pieces can make the package look poor even if total weight is technically acceptable. Include packaging fit and customer-facing appearance when choosing the practical tolerance for a commercial bakery SKU.
Measure spread around the target, not just the average
A batch can average exactly on target while containing many pieces that are too light and too heavy. Sample enough pieces to show the distribution: count how many fall below tolerance, within tolerance and above tolerance, and note the largest deviation. This reveals whether the process is centered and stable rather than merely producing an acceptable average by coincidence. If variation widens, trace the point where it enters—divider setting, manual cutting, bench flour, dough temperature, proofing delay or operator technique. The correction should address the source of spread instead of encouraging constant end-stage rework.
Translate repeated gram variance into yield and cost so the issue has commercial meaning. Average excess grams multiplied by pieces produced and dough cost per gram shows the hidden cost of consistent overweight. Underweight pieces create a different risk: guest inconsistency, poor value perception and, where applicable, declared-weight concerns. Use both economics and product quality when setting tolerance. When flour, hydration, mixer, divider or proofing process changes, mark the date and temporarily increase observation because the same nominal target can behave differently under the new process. That record helps managers avoid blaming the scaler when the real cause is upstream.
Use scaling data to target training instead of blaming individuals
When piece-weight variation rises, compare the pattern by product, dough condition, divider setting, time of day and method before deciding it is an employee-performance problem. If every operator struggles with one stiff dough or one divider after a maintenance change, the standard or equipment may be the real cause. If one operator shows a wider spread across several products under the same conditions, focused technique coaching may be appropriate. Show the employee actual samples and the acceptable range rather than only reporting an average. Then repeat the sample after training to see whether the distribution tightened. This evidence-based approach makes scaling control fairer and more useful: it protects yield and consistency while helping the bakery distinguish process weakness, equipment drift and genuine skill gaps.
Calibrate the measuring process
Scaling control depends on the measurement system itself. Check that scales are placed on stable surfaces, zero correctly and are verified according to the bakery’s procedure. Keep heavy vibration, flour buildup and rushed container changes from becoming hidden sources of variance. When two scales disagree, resolve the equipment question before coaching staff on piece weight; otherwise the bakery may train people to compensate for a bad measurement system.
Recheck after equipment maintenance
Divider, scale or mixer maintenance can change portion behavior even when settings appear unchanged. Take a short verification sample after relevant service and compare it with the established tolerance before assuming the old process remains centered.
Additional topic-specific operating notes
- scale available and checked according to the bakery’s routine
- baked size and quality reviewed alongside raw piece weight
- yield exceptions recorded rather than hidden in informal adjustments
- Expected pieces = usable dough weight / target piece weight
- Piece-weight variance = actual piece weight – target weight
- Yield loss = expected pieces – actual acceptable pieces
- Cost per unit = batch cost / acceptable finished units
- sample throughout the batch instead of only at the start
- separate process problems from scale or dough-condition problems
- compare expected and actual finished units after bake
A dough batch should produce 96 rolls at 85 g each, but the finished count is 90. The six-unit gap may come from overweight pieces, trim loss or damaged product. Measuring piece weights during production identifies the cause before the variance becomes a recurring cost.
Useful next resource
Piece-weight control chart for supervisors
The easiest way to see whether scaling is drifting is to sample pieces across the batch rather than only at the start. A supervisor can record target weight, allowed tolerance, five to ten sample weights, average deviation and the number outside the acceptable range.
| Pattern | What it suggests | First correction |
|---|---|---|
| Most pieces are equally overweight | The process is centered above target. | Reset divider or cutting target and re-sample. |
| Average is on target but spread is wide | The method is unstable. | Check dough condition, manual technique, divider consistency or scale accuracy. |
| Weight drifts later in the batch | Dough temperature, rest time or equipment behavior may be changing. | Compare early and late samples and control the upstream condition. |
| Raw weights are consistent but baked size varies | The problem may be proofing, shaping or bake conditions rather than scaling. | Move the investigation downstream instead of changing piece weight. |
Supervisor response when variance appears
- Confirm the scale is zeroed and reliable.
- Take a fresh sample from the current batch.
- Identify whether the issue is center, spread or time-related drift.
- Correct one likely cause and sample again.
- Record the result so repeated problems can be linked to product, equipment or dough condition.
This prevents the common reaction of trimming or adding dough to every piece at the end of the process. A stable scaling system should control the source of variation so yield, bake consistency and packaging fit improve together.
Use the Restaurant Operator Lab tools and related guides only when they directly support the decision described above. Open the free tools library