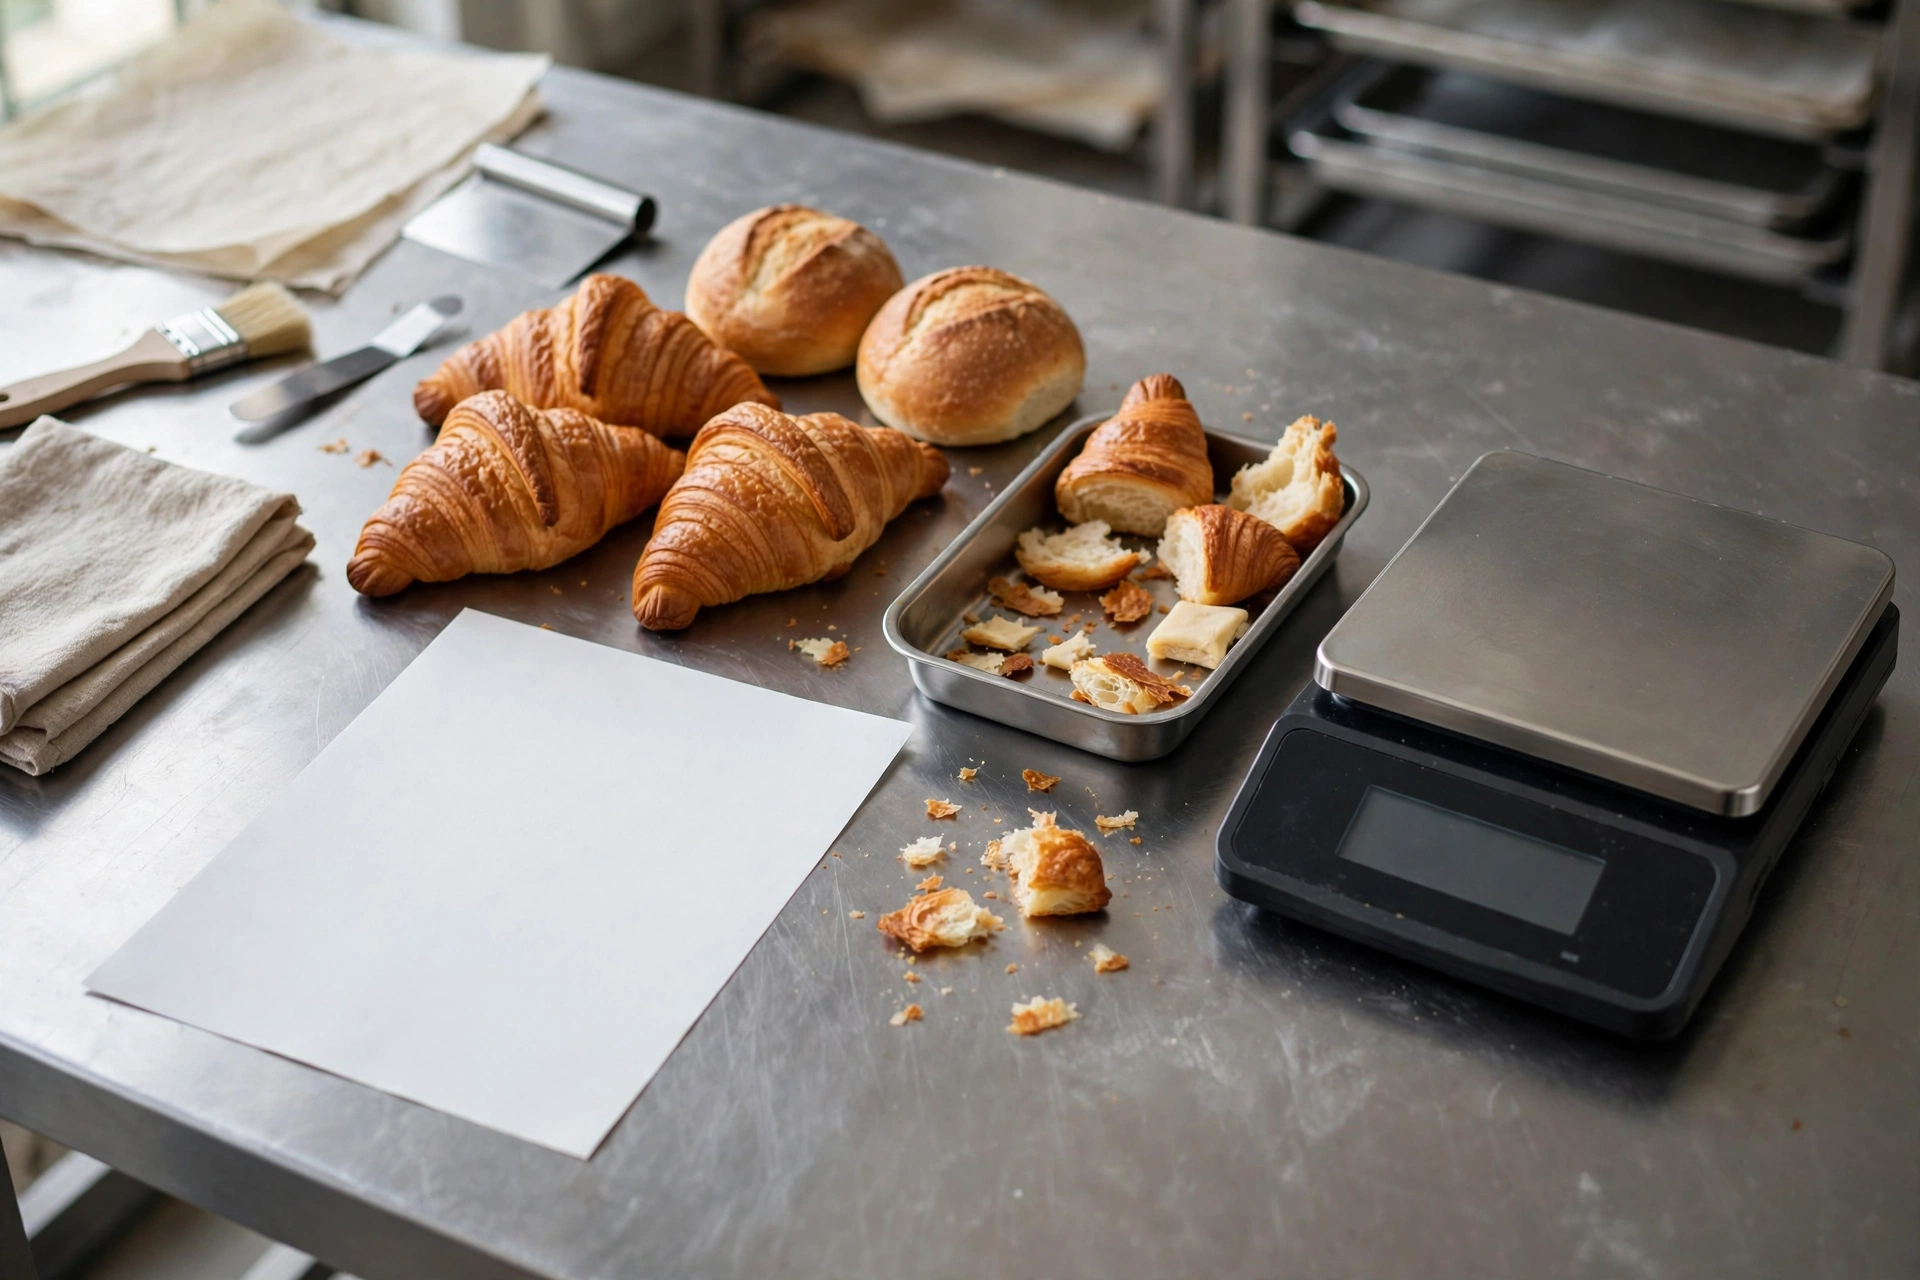
Bakery waste rarely comes from one dramatic mistake.
It usually leaks away in small amounts: dough left in the mixer, inconsistent scaling, excess flour during bench work, overbaking, breakage, trimming, damaged packaging, production that exceeds demand, and display stock that looks attractive but never sells.
Because these losses happen at different stages, a single end-of-day waste number is not enough. A bakery needs to know where the loss happened, how much was avoidable, and which operating decision created it.
This guide builds a practical system for measuring bakery yield from ingredient issue to final saleable product.
Start with the difference between yield and waste
Yield is the amount of usable or saleable product produced from a known input.
Waste is product value that is lost, discarded, damaged or produced without being sold or otherwise used as planned.
These are related, but they are not identical.
For example, moisture loss during baking may reduce product weight without being avoidable waste. A tray of burned croissants, however, is avoidable waste.
The first control principle is therefore:
Do not treat every weight loss as waste, and do not hide avoidable waste inside a normal yield standard.
Map the bakery production flow
Before measuring anything, define the production stages that matter in your operation.
A typical flow may look like:
- ingredient issue,
- mixing,
- dividing and scaling,
- shaping,
- proofing,
- baking,
- cooling,
- finishing or decorating,
- packing,
- display or dispatch,
- sale, transfer or discard.
Loss should be recorded at the stage where it occurs. Otherwise the bakery knows that product disappeared but not why.
Use three different control numbers
A practical bakery can separate performance into three simple measures:
- Process yield — what survives the production process.
- Saleable yield — what meets the bakery’s sellable quality standard.
- Sales yield — what is actually sold before it becomes unsold stock or waste.
This distinction prevents production quality and forecasting problems from being mixed together.
Measure dough yield after mixing
For dough-based products, start with total ingredient weight.
Illustrative example:
- Flour: 20 kg
- Water: 12 kg
- Other ingredients: 4 kg
Total formula weight:
36 kg
If usable dough recovered from the mixer is 35.4 kg:
Dough recovery yield = 35.4 ÷ 36 × 100 = 98.3%
The missing 0.6 kg may include dough left on the bowl, hook, scraper, floor, or equipment.
A small percentage can become material when the bakery repeats the batch many times each day.
Do not overreact to tiny measurement differences
Scales, ingredient handling and flour absorption can create small normal variation.
Set a reasonable tolerance instead of chasing every gram.
The purpose is to identify meaningful operational loss, not create false precision.
Measure scaling accuracy
Once dough is mixed, portion weight has a direct effect on both yield and food cost.
Suppose a dough batch should produce 100 pieces at 100 g each.
Target dough required:
100 × 100 g = 10,000 g
If the team averages 106 g per piece, the same dough will produce fewer saleable pieces.
Approximate pieces from 10 kg:
10,000 ÷ 106 = 94.3 pieces
The bakery loses roughly five to six potential pieces from the same dough quantity.
This is why scaling discipline matters more than it appears.
Track average portion weight, not just individual mistakes
One oversized pastry is insignificant.
A station that consistently scales 4% above standard is a system problem.
Check a sample:
- take 10 or 20 pieces,
- weigh them,
- calculate average weight,
- compare with target,
- coach the station if the average moves outside tolerance.
This gives better information than reacting to isolated examples.
Separate trim loss from handling loss
Some bakery products generate expected trim.
Examples include:
- laminated dough edges,
- pie crust trim,
- cake leveling,
- cookie cutting scraps,
- pastry sheet offcuts.
Record whether the trim is:
- reworked under an approved method,
- used in another approved product,
- discarded,
- counted as unavoidable process loss.
If trim is reused, the bakery should not automatically classify the full amount as waste.
Measure bake loss separately
Baking usually reduces weight through evaporation.
The formula is:
Bake yield % = Baked weight ÷ Pre-bake weight × 100
Illustrative example:
- Pre-bake dough weight: 12 kg
- Baked product weight: 10.2 kg
10.2 ÷ 12 × 100 = 85% bake yield
The 15% difference is not automatically waste. It may be normal moisture loss.
But if the bakery usually achieves 87% and suddenly falls to 81%, investigate baking time, temperature, proofing, product size and oven performance.
Standardize the point at which you weigh
A hot product can lose additional weight while cooling.
If one test is weighed immediately after baking and another after 30 minutes, the results may not be comparable.
Define the same measurement point every time, such as:
“Final yield weight is recorded after 20 minutes of cooling.”
Consistency makes the data useful.
Track unit yield as well as weight yield
Some products are easier to control by count.
For example:
- Expected muffins from batch: 120
- Saleable muffins produced: 116
Unit yield = 116 ÷ 120 × 100 = 96.7%
The missing four units may have been damaged, underfilled, overfilled or rejected for quality.
Use saleable yield for decorated products
A cake may technically survive production but fail the bakery’s presentation standard.
For premium or highly finished products, track:
- total completed units,
- saleable units,
- reworked units,
- rejected units.
This separates production quantity from commercial quality.
Record the reason for rejects
“Damaged” is too vague.
Use practical reason codes such as:
| Code | Reason |
|---|---|
| BAKE | Overbaked or underbaked |
| SHAPE | Incorrect shape or size |
| PROOF | Proofing problem |
| BREAK | Broken during handling |
| FINISH | Decoration or finishing defect |
| PACK | Packaging damage |
| EXPIRE | Unsold beyond internal sell-by rule |
| FORECAST | Overproduction / unsold |
Once reasons are coded, patterns become visible.
Overproduction is a different problem from production waste
A perfectly baked croissant that remains unsold at closing is not a baking failure.
It is usually a forecasting, display or sales-mix problem.
That distinction matters because the corrective action is different.
If waste is caused by overproduction, changing the recipe will not solve it.
Track production versus sales by product
For high-volume items, record:
- opening stock,
- units produced,
- transfers in or out,
- units sold,
- units remaining,
- units discarded,
- reason for discard.
A basic reconciliation is:
Opening stock + Production + Transfers in − Sales − Transfers out = Expected closing stock
Then compare expected closing stock with actual closing stock.
Use sell-through rate
Sell-through is one of the most useful bakery planning measures.
Sell-through % = Units sold ÷ Units available for sale × 100
Illustrative example:
- Units available: 100
- Units sold: 88
88 ÷ 100 × 100 = 88%
A low sell-through rate may indicate overproduction, weak demand, poor display timing, or an item that no longer deserves its current production volume.
Do not chase 100% sell-through blindly
A bakery that sells every unit by mid-afternoon may actually be underproducing and losing later sales.
The right target balances:
- availability,
- freshness,
- guest expectation,
- waste,
- gross profit.
The ideal closing stock is not necessarily zero for every product.
Measure stock-outs too
Waste data without stock-out data can encourage managers to cut production too aggressively.
Track both:
- unsold units at close,
- time of first stock-out,
- estimated missed demand if known.
This gives a more balanced view of production accuracy.
Use daypart production for fresh bakery items
Producing the entire day’s quantity early can increase stale stock and closing waste.
For products that can be baked or finished in waves, divide production into dayparts.
For example:
- opening batch,
- late-morning top-up,
- afternoon top-up,
- evening batch only if justified.
This allows production to respond to actual demand instead of committing the full quantity too early.
Use minimum display standards carefully
Bakery operators often want shelves to look full because a sparse display can reduce perceived choice.
But a permanently full display near closing can create predictable waste.
Define different display rules by time of day.
For example, full presentation at opening may be appropriate, while later hours may use smaller display quantities with backup stock held safely behind the counter.
Track display waste separately
Display loss may come from:
- drying,
- customer handling,
- temperature exposure,
- appearance deterioration,
- breakage,
- products remaining too long.
If display waste is high, the answer may be display quantity or rotation—not production itself.
Measure packaging loss
Bakery products can be damaged after production through poor packing.
Examples include:
- icing touching lids,
- cakes shifting in boxes,
- croissants crushed during stacking,
- labels applied incorrectly,
- wrong package size,
- condensation caused by packing before sufficient cooling.
These are avoidable losses and should be visible.
Cooling is part of yield control
Packing too early can damage texture and shelf life.
Holding too long can also increase handling and exposure.
Standardize cooling time or product condition before:
- slicing,
- icing,
- packing,
- display.
Yield control is not only about ingredient weight. Process timing matters too.
Use batch size that matches demand
A large batch can reduce labor per unit but increase overproduction risk.
A small batch can improve freshness but increase labor and oven inefficiency.
The correct batch size balances:
- demand pattern,
- oven capacity,
- proofing capacity,
- labor,
- freshness window,
- waste risk.
Our Bakery Production Planning guide explains how to set daily batch quantities using demand and operational capacity.
Use historical demand by weekday
Monday should not automatically receive the same production quantity as Saturday.
Build a simple production history by:
- weekday,
- product,
- daypart,
- season,
- holiday or event.
Then compare:
- planned production,
- actual production,
- sales,
- waste,
- stock-out time.
This turns production planning into a data process instead of a habit.
Use a waste value, not only a waste count
Ten unsold low-cost rolls may matter less financially than two damaged premium cakes.
Track both quantity and value.
Waste value = Waste quantity × Standard unit cost
Illustrative example:
- 8 pastries wasted
- standard cost per pastry: $0.85
8 × $0.85 = $6.80 waste value
This helps managers prioritize.
Do not use selling price as food waste cost
For food-cost control, waste is normally valued at its relevant standard product cost, not the full menu selling price.
Selling price can be useful when estimating lost revenue, but it is a different measure.
Keep the two concepts separate.
Track waste as a percentage of production cost
One simple measure is:
Waste % = Waste cost ÷ Production cost × 100
If weekly production cost is $5,000 and recorded bakery waste cost is $225:
$225 ÷ $5,000 × 100 = 4.5%
This figure becomes more useful when tracked over time and broken down by reason.
Separate planned sampling from uncontrolled waste
Product used for legitimate tasting, staff training, photography or approved sampling should be coded separately.
Otherwise managers may think production performance is deteriorating when the loss was planned.
Control staff consumption separately
Employee meals, approved tasting and unauthorized consumption should not all disappear into a generic waste category.
Use the restaurant’s own policy and local requirements, but make the operational category visible.
Use a daily bakery waste log
A useful daily log can include:
| Field | Purpose |
|---|---|
| Date / shift | When the loss happened |
| Product | What was lost |
| Quantity | Units or weight |
| Standard cost | Cost value |
| Reason code | Cause category |
| Stage | Mixing, shaping, bake, pack, display, close |
| Comment | Useful context |
| Action | What should change |
This should take seconds to complete, not become an administrative burden.
Review the top three waste causes weekly
Do not try to solve twenty small issues at once.
Each week, identify:
- highest waste value by product,
- highest waste value by reason,
- largest recurring production variance.
Then assign one or two corrective actions.
This keeps the system practical.
Watch for hidden waste inside rework
Reworking trim or unsold product can be efficient when it is safe, approved and consistent with quality standards.
But rework can also hide a bad process.
If a bakery repeatedly produces too much product because “we can use it tomorrow,” the underlying forecasting problem remains.
Track rework quantities so they do not become invisible.
Do not compromise food safety to reduce waste
Waste reduction never justifies extending shelf life, reusing unsafe product or ignoring temperature and handling rules.
Internal sell-by limits, cooling, storage and reuse rules should follow applicable food-safety requirements and company standards.
Cost control comes after safety.
Connect bakery yield to recipe cost
Yield affects the true cost of each saleable unit.
Suppose a batch costs $48 and the theoretical recipe says it produces 60 units.
Theoretical unit cost:
$48 ÷ 60 = $0.80
If the bakery consistently produces only 56 saleable units:
Actual standard unit cost based on saleable yield:
$48 ÷ 56 = approximately $0.86
A six-cent difference may look small, but it becomes material at high volume.
Our Bakery Product Cost guide explains the broader costing process.
Connect bakery yield to recipe yield testing
For ingredients and production stages where weight changes materially, formal yield testing can improve costing accuracy.
Use our Restaurant Recipe Yield Test framework to calculate usable yield and true ingredient cost.
Connect bakery waste to the general waste log
If your operation also runs a restaurant kitchen, keep the bakery data compatible with the wider waste system.
The Restaurant Waste Log guide provides a broader structure for recording food waste and identifying cost leaks.
Audit high-cost products more frequently
Not every bakery item needs the same control intensity.
Prioritize:
- butter-heavy laminated products,
- premium cakes,
- items with expensive fillings,
- products with short shelf life,
- products with high breakage,
- items that regularly remain unsold.
Management time should follow financial impact.
Use a simple weekly bakery control dashboard
A compact weekly review might include:
- production value,
- sales value,
- waste cost,
- waste %,
- sell-through %,
- stock-out incidents,
- top three waste products,
- top three waste reasons,
- largest yield variance.
This is enough to run a useful conversation without drowning the team in metrics.
Investigate trends, not isolated bad days
One bad bake does not necessarily require a system change.
Look for repeated movement.
For example:
Waste %: 3.1% → 3.4% → 4.2% → 5.0%
A clear upward trend deserves investigation even if no single day looks disastrous.
Use root-cause categories
When waste rises, ask which type of problem is driving it:
- forecasting,
- portioning,
- recipe or process,
- equipment,
- training,
- supplier quality,
- handling,
- display strategy,
- packaging.
The corrective action should match the category.
Examples of corrective actions
If waste comes from overproduction:
- reduce first batch size,
- increase top-up production,
- improve weekday forecasting.
If waste comes from inconsistent scaling:
- check scales,
- retrain the station,
- sample average piece weight.
If waste comes from bake defects:
- check oven calibration,
- standardize loading,
- review proofing,
- verify timer and temperature procedure.
If waste comes from display stock:
- reduce late-day display quantity,
- use smaller presentation trays,
- improve product rotation.
Do not reward low waste if availability suffers
A manager can reduce waste quickly by underproducing.
That is not good control if the bakery repeatedly sells out of high-margin products too early.
Review waste and stock-outs together.
A balanced goal is:
low avoidable waste + strong availability + consistent quality.
Do not reward high yield if quality falls
Yield can be improved artificially by underbaking, under-trimming, underfilling or lowering quality.
That is not real improvement.
A bakery standard should protect:
- recipe,
- portion,
- appearance,
- texture,
- food safety.
Only after those standards are met should yield be optimized.
A practical 30-day improvement plan
Week 1: establish baseline waste by product and reason.
Week 2: check scaling, batch size and bake yield on the highest-cost items.
Week 3: adjust daypart production and display quantities where overproduction is clear.
Week 4: compare waste, sell-through and stock-outs against the baseline.
Do not change too many variables at once. Otherwise you will not know which intervention produced the result.
The best bakery waste system makes loss visible early
Bakery waste should not be discovered only when the monthly food-cost percentage looks bad.
By then, the operation has already lost the product.
A strong system identifies loss at the point it occurs: mixer, bench, oven, finishing table, packing station, display or closing count.
Once yield and waste are measured by stage, operators can distinguish normal production loss from avoidable loss, control batch quantities more accurately, and protect food cost without reducing freshness or quality.
Measure production accuracy, not only waste
A bakery can reduce waste and still plan badly if it repeatedly underproduces. Compare actual demand with planned production.
Production accuracy % = 1 − |Produced units − Required units| ÷ Required units
Use this as a directional planning metric rather than a universal target. Review it together with sell-through, stock-outs and waste so managers cannot improve one number by damaging another.
Set item-specific action thresholds
High-cost cakes, laminated pastry and short-shelf-life products may deserve tighter review than inexpensive stable items. Define when waste value, low sell-through or early stock-out triggers a change to the next comparable day’s batch plan.
Frequently asked questions
Is bake weight loss always waste?
No. Normal moisture loss can be part of the approved process yield. Waste should identify avoidable loss such as defects, damage, overproduction or discard.
Should bakeries aim for 100% sell-through?
Not automatically. Selling out too early may mean lost demand. Balance closing waste with availability, freshness and contribution.
What should be reviewed first when bakery waste rises?
Start with the highest waste value by product and reason, then check whether the cause is forecasting, scaling, baking, handling, packaging or display.
Operational note: The examples and percentages in this guide are illustrative. Product shelf life, reuse, storage, food-safety and discard rules should follow applicable local regulations and your bakery’s approved procedures.