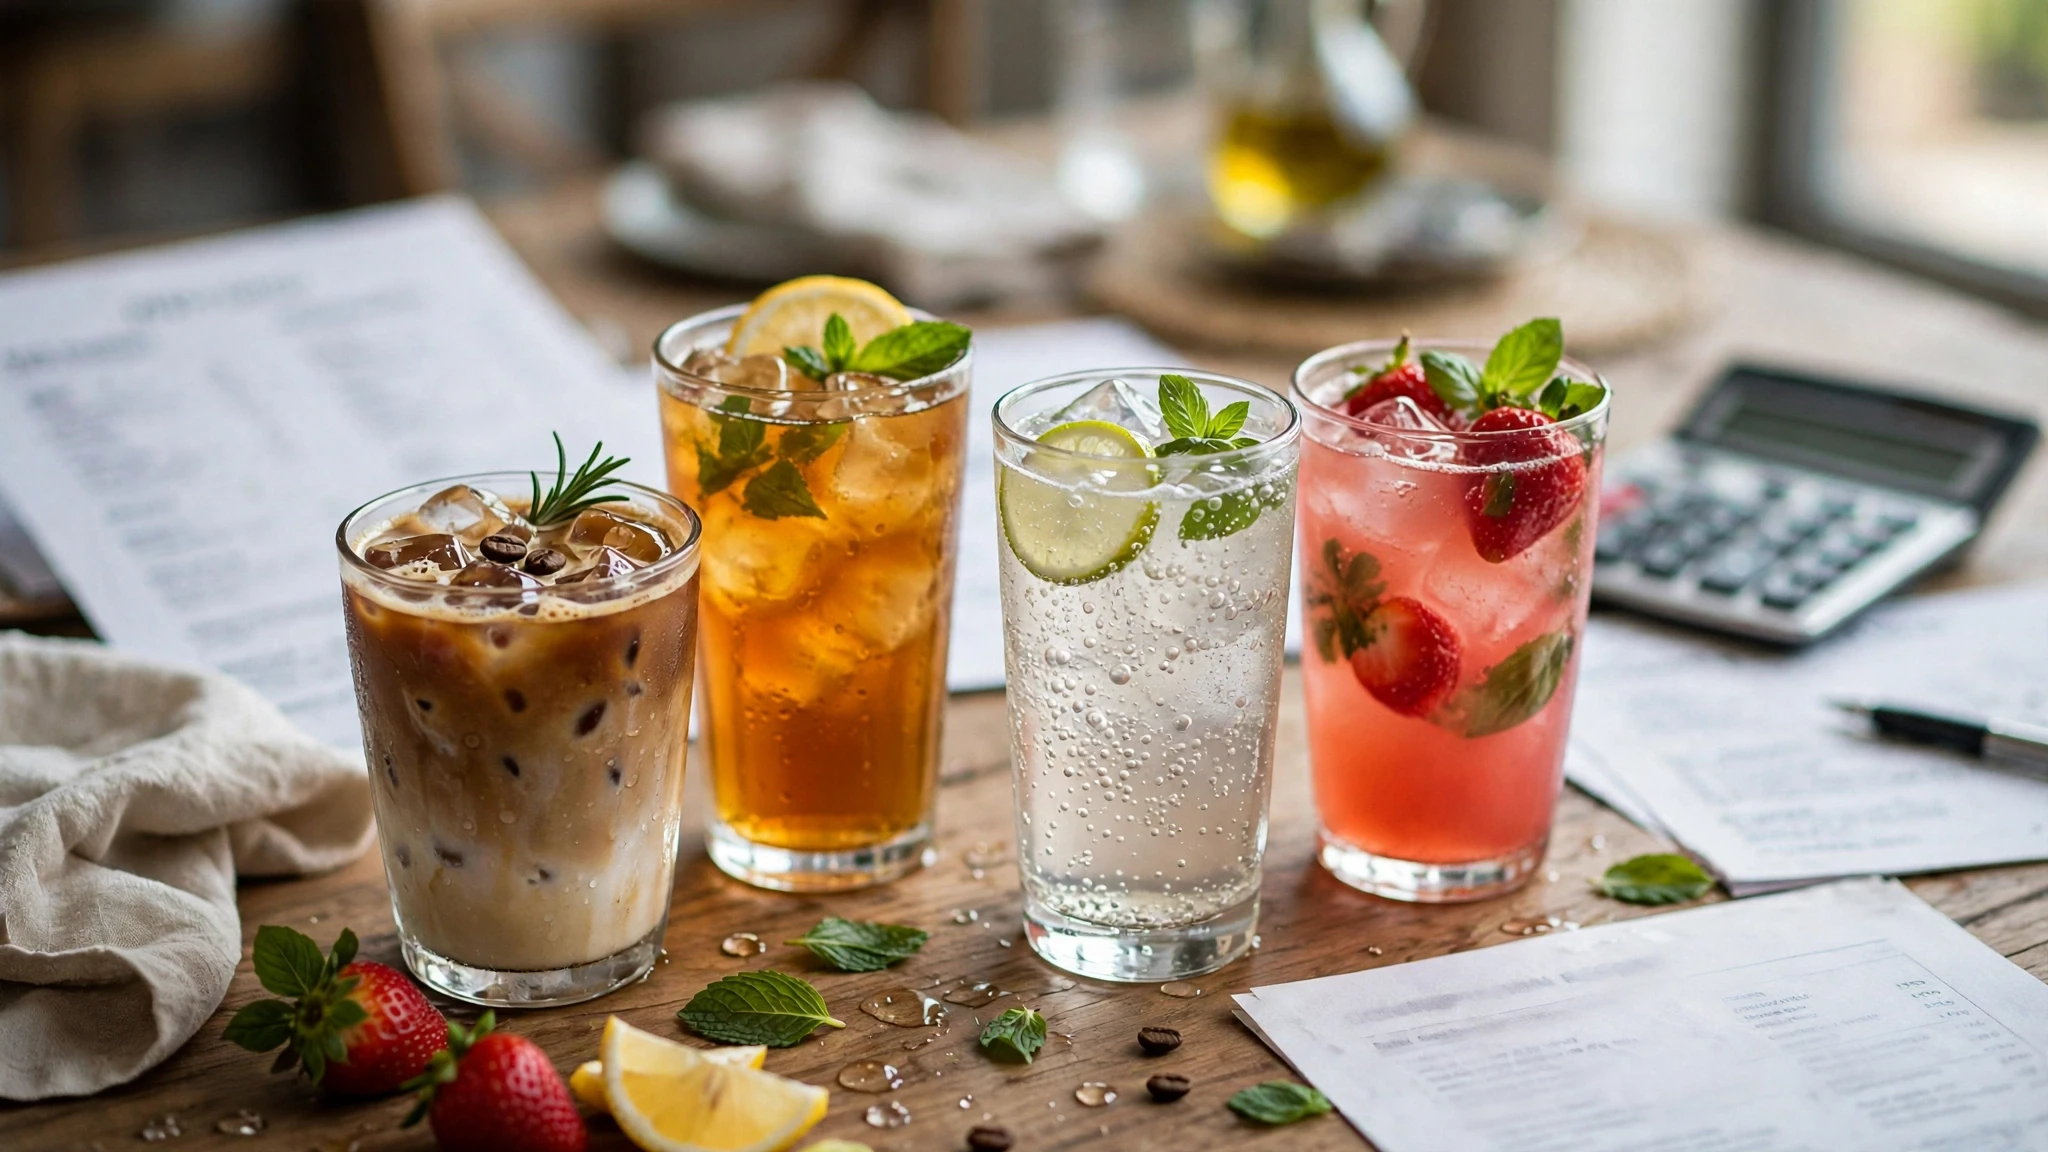
Beverages can produce strong contribution, but a beverage menu can also become a collection of legacy prices, duplicated choices and low-volume ingredients.
Operators often review beverage cost percentage without asking which drinks actually drive contribution, attach to meals, slow the bar, require unique inventory or occupy valuable menu space.
Beverage menu engineering applies the same disciplined questions used on food items while respecting the different role drinks play in the guest transaction.
Separate beverage categories
- Non-alcoholic fountain/bottled beverages.
- Coffee/tea.
- Fresh or specialty non-alcoholic drinks.
- Beer/wine/spirits where legally applicable.
- Cocktails or mixed beverages.
- Shakes/dessert beverages.
- Delivery-specific bottled/canned options.
Analyze categories separately because cost structure, prep, service and guest decision behavior can differ.
Use contribution dollars
Contribution = selling price − direct beverage cost under the restaurant’s chosen definition.
A drink can have a higher cost percentage and still produce more contribution dollars than a lower-cost drink.
Combine demand and contribution
| Pattern | Management question |
| High demand + high contribution | protect availability, placement and execution |
| High demand + low contribution | review price, pour/portion, recipe or modifier |
| Low demand + high contribution | review visibility, naming, server recommendation or category role |
| Low demand + low contribution | challenge menu space and inventory complexity |
Measure attachment
Beverage attachment asks how often a relevant food transaction includes a beverage.
Use the denominator that makes sense for the concept: dine-in covers, eligible transactions, entree orders or another consistent base.
Do not compare concepts with different service models as if one universal attachment rate exists.
Measure category mix
Within beverages, track share of sales/units by category. A change from fountain drinks to specialty drinks can improve or weaken contribution depending on price/cost and labor.
Review price architecture
Map entry, core and premium price points within each category. Large unexplained price gaps or tiny gaps between clearly different products can distort guest choice.
Restaurant Menu Price Increase Plan: Raise Prices Without Random Gaps.
Control modifiers
Extra shots, syrups, milk alternatives, flavor add-ons, premium spirits or size upgrades should have controlled quantity and pricing.
Restaurant Modifier Profitability: Price Add-Ons and Extras.
Include preparation labor where material
A bottled beverage and a labor-intensive specialty drink may show similar direct ingredient contribution but very different station workload.
Do not force arbitrary labor allocation into every beverage. Include workload/throughput as an operational dimension.
Track bar or beverage-station capacity
A promotion that shifts many orders into blended drinks or complex cocktails can overload equipment and slow the entire order.
Review ticket/production effect before pushing a high-contribution drink harder.
Challenge unique low-use inventory
A beverage that requires one syrup, garnish, spirit or package used nowhere else adds inventory complexity.
Low sales can create dead stock, spoilage or slow-moving bottles/ingredients even when unit contribution is high.
Use paired/basket behavior
Some drinks attach strongly to certain food categories. Review common pairings where POS data support it.
A beverage with moderate standalone economics may still support a profitable meal bundle or increase transaction contribution.
Analyze free refills carefully
Where the concept offers refills, the menu price covers a service model rather than one physical pour.
Use actual beverage cost/usage data and concept policy. Do not invent a universal refill assumption.
Review size ladder
Small, medium and large should have a deliberate price and quantity relationship. The size upgrade should not accidentally give away disproportionate product for a token price increase unless that is a conscious value strategy.
Review beverage waste
Overpour, remakes, expired prepared beverages, draft loss, incorrect builds and unrecorded comps can change actual cost.
Restaurant Beverage Cost Control: How to Track Drink Cost, Waste and Variance.
Separate menu engineering from control variance
Menu engineering decides what to sell and at what position/price. Beverage cost control investigates why actual usage differs from standard.
Both are needed. A profitable recipe can still be poorly controlled; a perfectly controlled drink can still be a weak menu item.
Build a beverage scorecard
| Measure | Why it matters |
| Units sold | demand |
| Selling price | guest price |
| Direct cost | recipe/purchase input |
| Contribution dollars | economic output |
| Attachment/category share | transaction role |
| Unique inventory | complexity |
| Prep time/station load | operational burden |
| Waste/remake signal | control risk |
Use menu placement deliberately
Prominent placement should support business goals, not simply the owner’s favorite drink. Test whether guests can understand category choices and premium/value differences quickly.
Use server recommendations with guardrails
Servers can recommend beverages that fit the guest experience and menu, but do not build a compensation/pressure system that creates misleading claims or poor service.
Training should emphasize product knowledge, current availability and appropriate pairings.
Example: high margin percentage, weak item
A specialty drink has low ingredient cost percentage but sells only a few units, needs a unique puree, and slows the blender station.
Its percentage looks attractive while its total contribution and complexity are weak. It becomes a redesign or retirement candidate.
Example: higher-cost drink, strong contribution
A premium beverage has a higher direct-cost percentage but sells at a substantially higher price and contributes more dollars per order.
Management evaluates it by contribution and guest role rather than rejecting it because percentage cost is higher.
Review beverage promotions separately
Discounted beverage offers can shift attachment and mix. Measure incremental contribution and cannibalization rather than redemptions alone.
Manager monthly beverage review
- Top drinks by units and contribution.
- Low-volume unique-inventory drinks.
- Attachment trend by daypart/channel.
- Modifier/add-on contribution.
- Actual beverage cost variance.
- Station bottlenecks/remakes.
- Price gaps within size/category ladders.
- Items to protect, promote, redesign or retire.
Common beverage-engineering mistakes
Ranking only by cost percentage
Contribution and demand are ignored.
Adding drinks without removing complexity
The beverage menu and inventory expand indefinitely.
Ignoring station workload
A promoted drink slows all orders.
No modifier control
Extras create hidden cost.
Treating every beverage category the same
Guest behavior and operational model differ.
Frequently asked questions
What is a good beverage cost percentage?
Use the restaurant’s actual recipe/purchase economics and concept targets rather than a universal benchmark.
Should the most profitable beverage be placed first?
Placement should balance guest decision clarity, category role, contribution and concept strategy—not one metric.
How often should beverage menus be reviewed?
Use a regular menu cycle and event-driven reviews after material cost, demand or operational changes.
Should low-selling drinks always be removed?
No. Review contribution, guest role, inventory sharing and operational complexity.
Next action
Export the last eight to twelve weeks of beverage units and sales. Add direct cost and contribution to the top 20 drinks, then mark unique inventory and prep complexity. The drinks that are low demand, low contribution and high complexity are the first redesign/retirement candidates.
Related guides: