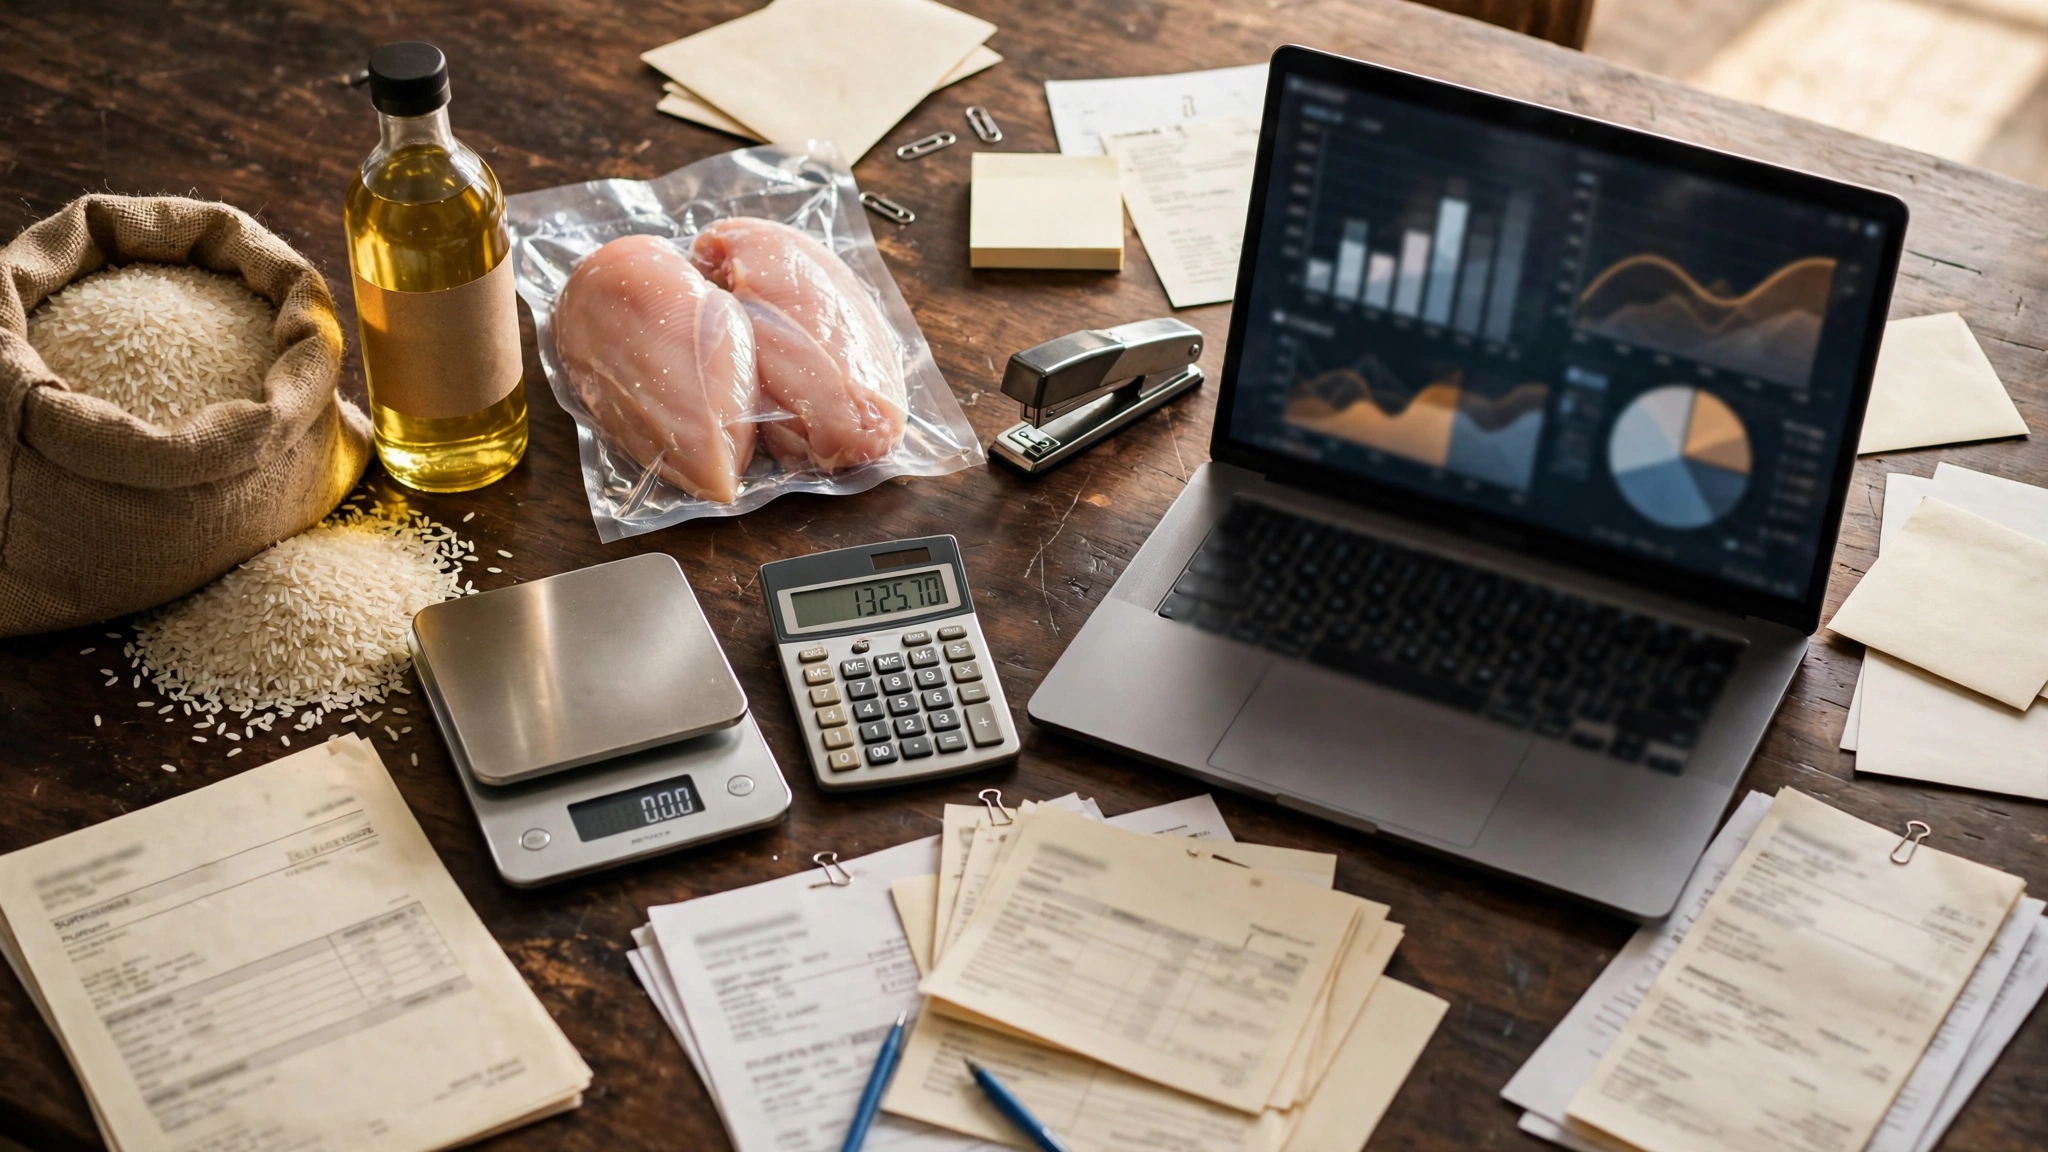
A restaurant can know that food cost is high and still not know what to fix.
The total percentage may move from 30% to 32%, but that does not tell the manager whether the problem came from proteins, produce, dairy, dry goods, bakery inputs, beverages or another purchasing group.
Category-level food cost solves that diagnostic problem.
Instead of asking only:
What is our food cost percentage?
The manager asks:
Which ingredient category moved, by how much, and what operating cause explains it?
The purpose is not to create more accounting work. It is to turn a broad cost result into a shorter list of operational questions.
Start with a stable category structure
Choose categories that reflect how the restaurant actually buys and uses product.
A practical structure might include:
• proteins,
• produce,
• dairy,
• dry goods,
• bakery or bread,
• oils and frying products,
• beverages used in food operations,
• packaging if treated as direct product cost,
• other concept-specific categories.
Do not create 25 categories because the accounting system allows it. If managers cannot act differently on two categories, they may not need to be separate.
A steakhouse may need beef, seafood and poultry split individually. A café may need coffee, dairy, bakery and disposables. A bakery may separate flour, butter, chocolate, fillings and packaging.
The category structure should match operating decisions.
Define the denominator before comparing percentages
There are two different questions a restaurant may ask.
Category cost as a percentage of total sales
Category cost % of sales = Category cost ÷ Net sales × 100
This shows how much of restaurant sales is being consumed by that category.
Category cost as a percentage of total food cost
Category share of food cost = Category cost ÷ Total food cost × 100
This shows which categories make up the cost base.
Do not confuse the two.
If protein cost is 12% of sales and 40% of total food cost, those are different management views.
Use beginning inventory, purchases and ending inventory by category
For a reliable usage-based category cost:
Category cost used = Beginning category inventory + Category purchases – Ending category inventory
Example:
Protein category:
• beginning inventory: $8,400,
• purchases: $17,200,
• ending inventory: $7,900.
Protein cost used:
$8,400 + $17,200 – $7,900 = $17,700
If net sales were $120,000:
$17,700 ÷ $120,000 × 100 = 14.75%
The example is illustrative.
The calculation is only as reliable as the category mapping and inventory counts.
For the broader weekly food-cost process: Restaurant Food Cost Analysis: A Weekly Review System for Operators
Do not use purchases as a substitute for usage without labeling it
Managers often review “protein purchases this week” and call it protein cost.
That can be misleading.
A large delivery before the period ends raises purchases but may remain in inventory. A category-level purchase ratio can still be useful for short-term monitoring, but label it honestly.
Examples:
• protein purchases % of sales,
• dairy purchases per week,
• produce purchase variance.
Do not call those numbers “actual category food cost” unless inventory movement is included.
Map every ingredient to one category
Category reporting fails when the same item moves between groups.
Create one controlled ingredient master with fields such as:
• ingredient name,
• supplier item code,
• count unit,
• purchase unit,
• category,
• current unit cost.
Examples:
| Ingredient | Category |
|---|---|
| Chicken breast | Protein |
| Roma tomatoes | Produce |
| Mozzarella | Dairy |
| Flour | Dry goods |
| Frying oil | Oils |
Keep the mapping consistent across purchasing, inventory and recipe costing.
Use categories to isolate price versus usage problems
A category cost increase usually comes from one or more of four drivers:
1. purchase price increased,
2. usage increased,
3. yield worsened,
4. sales/menu mix changed.
Category analysis narrows the investigation.
Suppose protein cost rises 1.4 percentage points while produce and dairy remain stable.
The manager should not launch a restaurant-wide waste campaign. Start with protein-specific questions:
• Did purchase price rise?
• Did the menu sell more protein-heavy items?
• Did trim or cooking yield change?
• Are portions larger?
• Was product wasted or spoiled?
• Did inventory count accuracy change?
Compare category actual cost with theoretical demand
A strong category review connects usage to recipes and sales.
Theoretical category usage estimates what should have been consumed based on items sold and standard recipes.
Actual versus theoretical analysis can then be grouped by category.
If theoretical protein cost is $16,600 and actual protein cost is $17,700:
Protein variance = $17,700 – $16,600 = $1,100 unfavorable
That variance does not identify the cause by itself, but it tells management where to investigate.
For the broader method: Actual vs Theoretical Food Cost: How to Find the Gap
Protein category: focus on price, yield and portion
Protein often has high unit value and meaningful yield loss.
Review:
• supplier price movement,
• pack specification,
• trim yield,
• raw-to-cooked yield,
• portion weight,
• substitution,
• spoilage,
• unrecorded staff meals or comps,
• high-cost item mix.
A small percentage change in protein yield can materially change food cost.
Do not use a generic expected yield without testing the restaurant’s own product and process.
Produce category: separate market movement from operational loss
Produce cost can move because of:
• seasonal price changes,
• short shelf life,
• trim,
• over-prep,
• spoilage,
• poor rotation,
• specification change,
• inconsistent receiving quality.
If produce purchases rise but sales are stable, inspect both price and waste.
A cheaper case is not cheaper if usable yield is materially worse.
Dairy category: watch price and portion creep
Dairy may include:
• cheese,
• cream,
• milk,
• butter,
• yogurt,
• specialty dairy products.
Cheese is especially vulnerable to portion creep when service uses handfuls, unverified scoops or free-pour application.
For high-use dairy components, verify:
• serving tool,
• standard weight,
• current unit cost,
• recipe quantity.
Dry goods: look for hidden broad movement
Dry goods often contain many lower-cost items, so management attention can be weaker.
But the category can hide:
• flour and grain inflation,
• spice cost changes,
• canned goods increases,
• packaging-like ingredients,
• repeated small over-portioning,
• slow-moving inventory.
A category that is individually low-risk can still be material in total.
Separate frying oil when it matters
High-volume frying operations may benefit from a separate oil category.
Oil cost is affected by:
• purchase price,
• filtration discipline,
• fryer loading,
• contamination,
• replacement frequency,
• disposal practice.
If oil is buried inside dry goods, a meaningful operating issue may be harder to see.
Build a category cost bridge
A useful weekly or monthly table can look like this:
| Category | Prior % sales | Current % sales | Change | Main driver |
|---|---|---|---|---|
| Protein | 13.5% | 14.8% | +1.3 pts | Price + portion review |
| Produce | 4.2% | 4.1% | -0.1 pts | Stable |
| Dairy | 3.6% | 4.0% | +0.4 pts | Cheese usage |
| Dry goods | 5.1% | 5.0% | -0.1 pts | Stable |
The figures are illustrative.
The point is not to chase every tenth of a point. Use internal materiality thresholds.
Compare category cost with menu mix
Category cost can rise for a good reason.
Suppose the restaurant sells more steak and fewer pasta dishes. Protein cost as a percentage of sales may rise while contribution dollars also improve.
Do not treat every category increase as waste.
Connect category movement to:
• sales mix,
• average selling price,
• menu item contribution,
• promotions,
• limited-time offers.
For menu-item profitability: Restaurant Menu Item Profitability: How to Measure Contribution Margin
The question is whether the category movement matches the sales mix and standards.
Use category-level purchasing variance
Track key suppliers and items within a category.
Example:
Protein category increased $2,400 versus plan.
Break it down:
• chicken price: +$700,
• beef price: +$850,
• seafood mix: +$500,
• unexplained usage: +$350.
Now management has four different actions instead of one food-cost problem.
Set review frequency by volatility
Not every category needs the same cadence.
Possible approach:
• proteins: weekly,
• produce: weekly,
• dairy: weekly or biweekly,
• dry goods: monthly with exception alerts,
• oils: weekly in fryer-heavy concepts.
The cadence should reflect value, volatility and management effort.
Protect category consistency during substitutions
Supplier substitutions can break reporting.
Example:
A dairy-based sauce normally arrives as a prepared product classified under dairy. During a shortage, the restaurant buys component ingredients and produces it in-house. If those ingredients are classified across dairy, produce and dry goods, the category trend changes.
That may be correct economically, but document the change so managers do not misread it as uncontrolled variance.
Worked example: food cost rises two points
Assume total food cost rises from 29.8% to 31.8% of sales.
A category review shows:
• protein: +1.1 points,
• dairy: +0.6 points,
• produce: +0.2 points,
• dry goods: +0.1 points.
The manager reviews protein and finds:
• supplier beef price increased,
• one high-volume chicken portion is 12 grams over standard,
• one promotion increased mix toward a protein-heavy entrée.
Dairy review finds cheese usage above theoretical.
The corrective plan becomes:
1. compare alternate beef quotes,
2. retrain and verify chicken portion tools,
3. re-cost the promotion,
4. weigh cheese portions during two peak shifts,
5. recheck category cost next week.
That is far more actionable than “food cost is two points high.”
Category review workflow
- Confirm that beginning and ending inventory use the same category mapping.
- Import purchases by category and verify supplier/item coding.
- Calculate category usage from beginning inventory, purchases and ending inventory.
- Compare actual category usage with sales and theoretical demand.
- Rank categories by material variance dollars instead of chasing tiny changes first.
- Drill into price, yield, portion, waste and menu mix to identify the likely cause.
- Assign one corrective action to each material category and verify the result next period.
Assign category ownership and exception thresholds
Category reporting is stronger when one manager knows who is expected to investigate each group. Ownership does not mean that person controls every purchase. It means the exception reaches someone who can coordinate the response.
Examples:
• kitchen manager: proteins and produce,
• bakery lead: flour, butter and fillings,
• general manager: broad supplier price movement,
• purchasing manager: vendor substitutions and contract items.
Set a materiality rule so the team does not investigate every tiny movement. A category might trigger review when it exceeds an internal dollar threshold, percentage-point threshold or repeated unfavorable pattern.
The threshold should reflect the restaurant’s scale. A $150 change may matter in one operation and be immaterial in another.
Use rolling trends, not only one-period comparisons
One bad week can come from timing, a large delivery or an unusual sales mix. Add a four- or eight-period trend where practical.
Look for:
• a category rising three periods in a row,
• recurring month-end spikes,
• seasonal produce movement,
• protein cost drifting after a supplier change,
• dairy usage worsening after a new menu item launch.
A rolling trend helps management distinguish noise from a developing control problem. It also makes corrective actions easier to verify: if a portion-control intervention works, the affected category should begin moving back toward its expected range.
Common category-cost mistakes
Too many categories
Managers stop using the report.
Inconsistent mapping
The trend becomes unreliable.
Using purchases as actual cost
Inventory timing distorts results.
Ignoring sales mix
A profitable menu shift looks like a cost problem.
Looking only at percentages
Variance dollars may reveal a different priority.
No owner for the category
Nobody follows up on the driver.
Run the first category-cost review
- Take the most recently completed inventory period and confirm one consistent cutoff for beginning stock, purchases and ending stock.
- Split usage into the four to eight ingredient groups the restaurant can actually manage differently.
- Calculate each category’s cost in dollars and as a percentage of net sales using the same denominator.
- Rank the unfavorable movement by variance dollars and select the largest material category first.
- For that category, test price, yield, portion, waste and menu-mix explanations against actual records.
- Assign one corrective action to a named manager and define what number should improve if the action works.
- Recalculate the same category next period before expanding the investigation to lower-priority groups.
Category review worksheet
| Category | Current cost | Prior/target | Variance $ | Likely driver | Action | Owner | Recheck |
|---|---|---|---|---|---|---|---|
| Protein | Price / yield / portion / mix | ||||||
| Produce | Price / waste / trim | ||||||
| Dairy | Price / portion / mix | ||||||
| Dry goods | Price / usage / coding |
Use only the categories that matter to the operation. The purpose is to carry each material variance through to a named action and a recheck date.
Manager checklist
For each category with a material unfavorable change:
- Confirm the count is credible.
- Confirm purchases are coded correctly.
- Compare major item prices.
- Check menu mix.
- Review recipe portions.
- Inspect waste and spoilage.
- Review yield where relevant.
- Identify supplier substitutions.
- Quantify variance dollars.
- Assign one corrective action.
Frequently asked questions
Should every restaurant use the same food-cost categories?
No. Categories should match purchasing and operating decisions in the specific concept.
Is category food cost useful without theoretical food cost?
Yes. It can still isolate where actual usage changed. Theoretical data makes the diagnosis stronger.
Should packaging be included in food cost?
That depends on the restaurant’s internal cost model. Whatever treatment is chosen should be consistent and clearly labeled.
How many categories are enough?
Enough to create different management actions without making the report too fragmented. Many independent restaurants can start with four to eight useful groups.
Next action
Take the last completed food-cost period and split only the four largest ingredient groups. Do not redesign the accounting system yet. If one category explains most of the unfavorable movement, you have already turned a broad food-cost problem into a focused operating investigation.