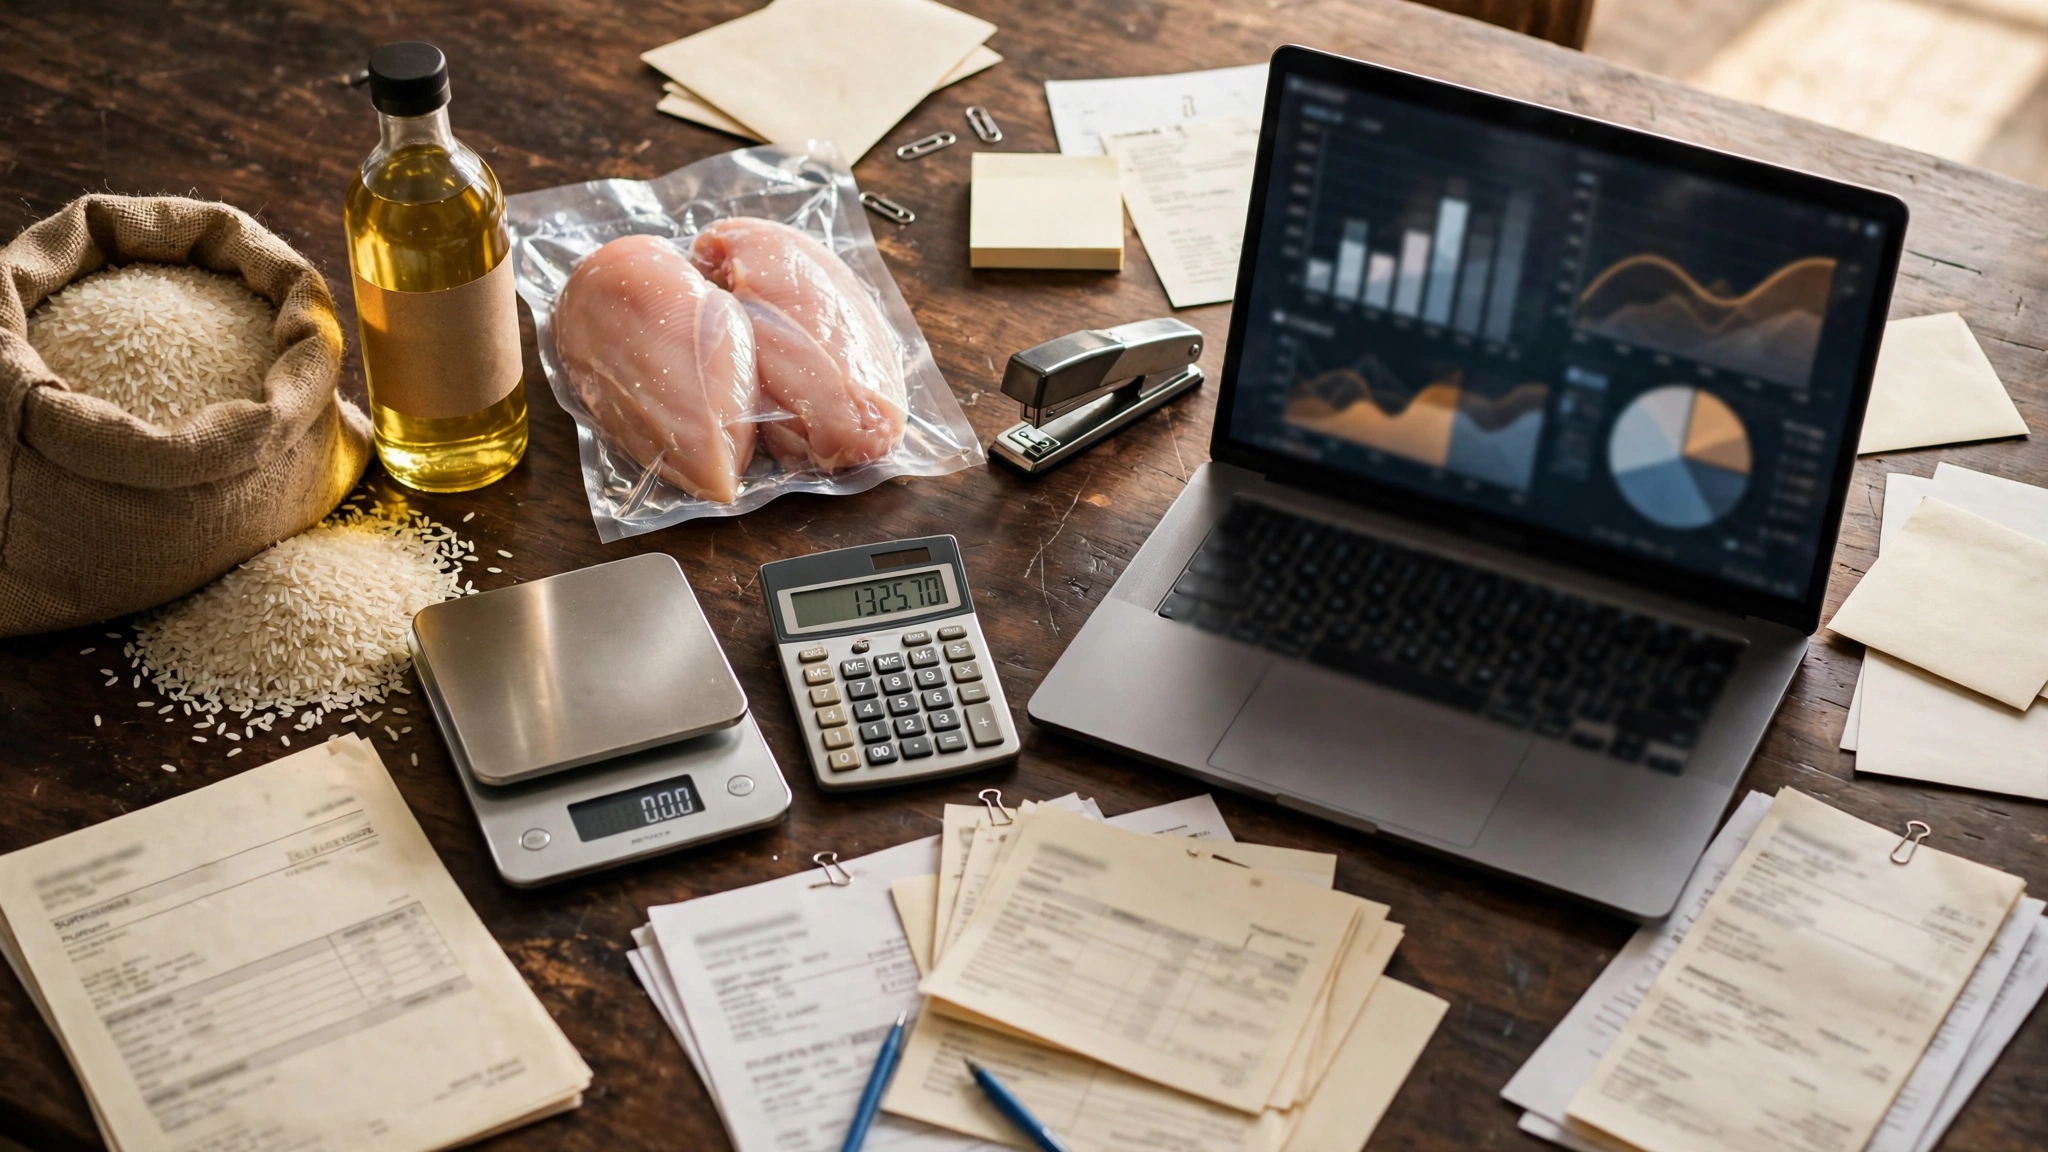
Food cost analysis is the weekly process of explaining what happened between the storeroom, the prep table, the plate and the sales report. The useful question is not simply whether food cost is “high” or “low.” It is whether the movement can be traced to purchase price, sales mix, yield, waste, portioning, inventory accuracy or timing. A strong review therefore starts with reconciled inventory and sales data, converts the percentage movement into dollars, and then tests the few operating causes that could realistically explain the variance. That makes food cost a management tool rather than a number managers argue about after the month is already closed.
Why a weekly food cost review beats a monthly surprise
Food cost can move quickly while the P&L arrives slowly. A protein price change on Monday, a poor-yield prep method on Tuesday and heavier sales of a low-margin item over the weekend can all affect the same percentage. If the operator waits until month-end, those causes are harder to reconstruct because the receiving records, waste notes and shift details are already old.
A weekly review keeps the evidence close to the event. It also prevents the common mistake of using purchases as a substitute for food used. A large delivery can make purchases look alarming even when inventory simply increased. Conversely, a quiet purchasing week can hide consumption from stock already on hand. The review should reconcile the period first, then ask which operational driver explains the change.
The result should be a short diagnosis, not a blanket instruction to “cut food cost.” Good actions are specific: verify a supplier increase, correct a recipe yield, retrain one portion, recover a missing credit or investigate a count discrepancy.
What the system should control
A reliable food-cost review depends on a few source controls being stable before the calculation begins. If counts, purchase timing or food-sales classification are inconsistent, the percentage can move even when kitchen execution has not changed.
- opening and ending inventory taken on the same basis
- purchases and credits posted to the correct period
- food sales separated from non-food revenue where the POS allows it
- waste, staff meals and transfers recorded consistently
- recipe and portion standards available for high-volume items
- supplier price changes and menu-mix shifts reviewed before blaming execution
For food cost, consistency means counting the same locations, using the same units of measure and closing the period at a comparable point in the operating cycle. If one week includes the bar storeroom and the next does not, or if case quantities are converted differently, the variance may be a measurement problem rather than an operating problem. Lock the counting scope and unit conversions before using the result to judge performance.
Core calculations and evidence
The weekly calculation should reconcile food used before anyone debates performance. Beginning inventory plus purchases minus ending inventory gives the cost consumed in the period; dividing by food sales converts it to a percentage. The math is intentionally simple so managers can spend their time explaining the variance rather than defending a complicated model.
- Food cost used = beginning inventory + purchases – ending inventory
- Food cost % = food cost used / food sales × 100
- Variance to target = actual food cost % – target food cost %
- Dollar impact = food sales × variance percentage points
Read the percentage beside food-sales dollars and category volume. A 1-point variance on $20,000 of food sales has a different economic weight from the same variance on $80,000, and the same percentage can come from very different mixes of proteins, beverages, sides and promotions. Convert the variance to dollars first, then investigate the categories with enough volume to explain it.
A practical review workflow
Run the food-cost review in the order the data is created: count inventory, reconcile purchases and transfers, calculate food used, compare the result, then test the plausible causes. This prevents the team from jumping straight to waste or portioning before the period itself is proven accurate.
- close the inventory period and verify counts
- reconcile purchases, credits and transfers
- calculate food cost used and food cost percentage
- compare against target, prior period and comparable sales mix
- separate price, mix, waste, yield and portion hypotheses
- assign one or two corrective actions with an owner and recheck date
Finish the weekly food cost review with a short cause-and-action list. If supplier price, portion drift and a missed credit explain the week, assign those three issues to the people who can actually fix them and define what evidence will be checked next period. Do not turn every minor observation into a project; preserve management time for the causes that explain most of the dollar variance.
Diagnose the variance before choosing the fix
Start by splitting the variance into causes that can be tested. Purchase-price variance is supported by invoice history. Yield variance needs prep or cook-yield evidence. Portion variance needs recipe standards and spot checks. Waste needs a waste record, not a guess. Mix variance needs item-level sales. Count error needs recounts or unit-conversion checks. This sequence matters because each cause has a different owner and a different remedy.
Document the conclusion in a form that another manager could verify: “Chicken breast invoice cost rose 8%; three top-selling dishes use that item; estimated weekly impact $X; purchasing manager to request alternate quote by Thursday.” If the cause is still uncertain, record the test you will run next rather than turning a suspicion into a fact.
Illustrative example
A restaurant posts 31.4% food cost against a 29.0% target on $42,000 in food sales. The 2.4-point variance is roughly $1,008. Rather than calling it “waste,” the manager finds a supplier price increase on proteins, two high-volume dishes selling more heavily than usual, and a missed credit. The review therefore produces three different actions instead of one vague cost-cutting instruction.
The sales, target and variance figures above are illustrative. Use your own recipe standards, sales mix and operating plan; the value of the example is showing how one food-cost percentage can contain several different causes that require different fixes.
A one-page weekly food cost review
A useful weekly sheet does not need every invoice line. Put the management view on one page: food sales, beginning inventory, purchases, ending inventory, food used, food cost %, target %, dollar variance and the top three suspected drivers. Add a small evidence column beside each driver so the manager records the invoice, waste log, recipe test or count issue that supports it.
Then add three action fields: action, owner and due date. A fourth field should state what will prove the action worked. For a supplier-price issue that might be a new quote; for a portion issue it might be five spot checks; for a count issue it might be a recount and unit-conversion correction. The worksheet becomes useful when the recheck is objective.
When to review daily, weekly and monthly
The full food cost calculation is usually most useful on the same cadence as reliable inventory counts. Supporting controls can run faster. Waste should be recorded as it happens, major supplier price changes should be reviewed when invoices arrive, and high-risk portions can be spot-checked during service. The monthly P&L then confirms whether the weekly operating actions are improving the broader result.
Food cost mistakes that create false conclusions
- Using purchases divided by sales and calling it food cost.
- Counting cases one week and individual units the next without a fixed conversion.
- Ignoring credits, transfers, staff meals or catering production that belongs to a different revenue stream.
- Blaming waste before checking purchase price, menu mix and count accuracy.
- Chasing a percentage while ignoring the dollar value of the variance.
- Changing recipes, vendors and menu prices at the same time, making the next result impossible to interpret.
Weekly implementation checklist
- Close inventory at the agreed day and time.
- Confirm all purchase invoices, credits and transfers are posted.
- Use food sales rather than total revenue when the POS can separate them.
- Calculate both percentage variance and dollar impact.
- Check the largest purchase-price changes before investigating kitchen execution.
- Review waste, yield and portion evidence for the items that can materially move the number.
- Assign no more than a few actions that can be rechecked within the next period.
Manager questions for a difficult week
- Did sales mix shift toward items with higher recipe cost?
- Which top-volume ingredients changed invoice cost?
- Were any credits, transfers or deliveries posted in the wrong period?
- Do yield tests still match the recipe costing assumptions?
- Are portions drifting on one or two high-volume dishes?
- Does the count sheet contain unusual quantities that deserve a recount?
Food cost analysis FAQ
Is weekly inventory always necessary?
No single cadence fits every operation, but the calculation is only as good as the inventory data behind it. High-volume or volatile operations often benefit from frequent counts of key categories even when the full inventory is less frequent.
Should food cost percentage be compared with an industry benchmark?
External benchmarks can provide context, but the stronger comparison is against your own menu, pricing, recipe standards and plan. Two restaurants with different concepts can have healthy economics at very different food-cost percentages.
What is the fastest way to investigate a sudden spike?
Verify the count and period first, then check major invoice changes and unusual sales mix. Only after those are ruled out should the team move deeper into waste, yield and portioning.
Can a lower food cost percentage still be bad?
Yes. A lower percentage can come from price increases, menu-mix changes or reduced portions that hurt guest value. Interpret the number with sales, contribution and guest feedback rather than treating “lower” as automatically better.
Next step
For the next inventory period, calculate food used, convert the variance to dollars and explain the largest driver with evidence. One clean weekly cycle is enough to expose where your data is weak and which control—receiving, counting, yield, waste or portioning—deserves the next improvement.
Contextual next step: Want to run the basic numbers with your own figures? Use the free Restaurant Operator Lab tools, then download the free Food Cost Worksheet if you want a simple one-period record. Open the free tools
Train managers to follow the number back to the kitchen
Training should use one real week. Give the manager the inventory totals, invoices, food sales and waste notes, then ask for a diagnosis before showing the answer. The skill to teach is not spreadsheet operation; it is deciding which evidence is strong enough to support a conclusion. Managers should be able to explain why a variance is probably price, mix, yield, portion, waste or count error and what additional evidence would prove it.
Build a three-level food cost rhythm
Use daily controls for events that disappear quickly: waste, receiving problems and obvious portion exceptions. Use the weekly review to reconcile the numbers and choose corrective actions. Use the monthly P&L to confirm whether the trend is improving at business level. This prevents the finance review from becoming the first place an operating problem is discovered.
What a good review produces
The output is not a perfect percentage. It is a short list of verified causes, a dollar estimate of what matters, and one or two actions that can be checked next week. When the same cause repeats, move it out of the weekly discussion and fix the underlying system: recipe specification, receiving control, count procedure, vendor management or training. That is how food cost analysis becomes operational learning instead of recurring firefighting.
Drill down only where the dollars justify it
Not every category deserves the same investigation time. If produce moved by a small amount but proteins account for most of the dollar variance, start with proteins. Within that category, rank the ingredients by purchase dollars and sales exposure. A high-volume chicken item with an 8% invoice increase can matter more than several small waste events combined. This Pareto-style approach keeps the review practical: verify the biggest financial drivers first, then move to smaller causes only if the remaining unexplained variance is still material. Managers should be able to stop the investigation when the evidence already explains the result well enough to choose a sensible action.