The Short Answer
To set bakery display pars and cut end-of-day waste, start with average sales by item, by daypart, from recent same-weekday history. Add a small buffer, then split each item’s daily par into morning, midday, and afternoon targets. Set a replenishment trigger, which is a shelf count that prompts a refill, instead of loading the full day’s quantity at open. Taper display quantities in the last hours of service. Then apply written rules for unsold product: carry over, mark down, donate, or discard.
The goal is not an empty case at 4 p.m. on every day. The goal is a display that looks full when customers are buying and runs lean when they are not, with leftovers that are predictable and handled the same way every time.
Display Pars vs. Production Pars
A production par tells the kitchen how much to bake. A display par tells the front-of-house team how much product belongs on the shelf at a given time. They are related but separate decisions. Production planning, including batch sizes, bake schedules, and dough timing, is covered in our Bakery Production Planning article. This guide covers what happens after product leaves the oven.
Keeping the two apart matters because the display is where most avoidable waste happens. Product that is baked but held in the back can often be redirected, frozen, or reworked. Product that sits under lights in an open case all afternoon usually cannot.
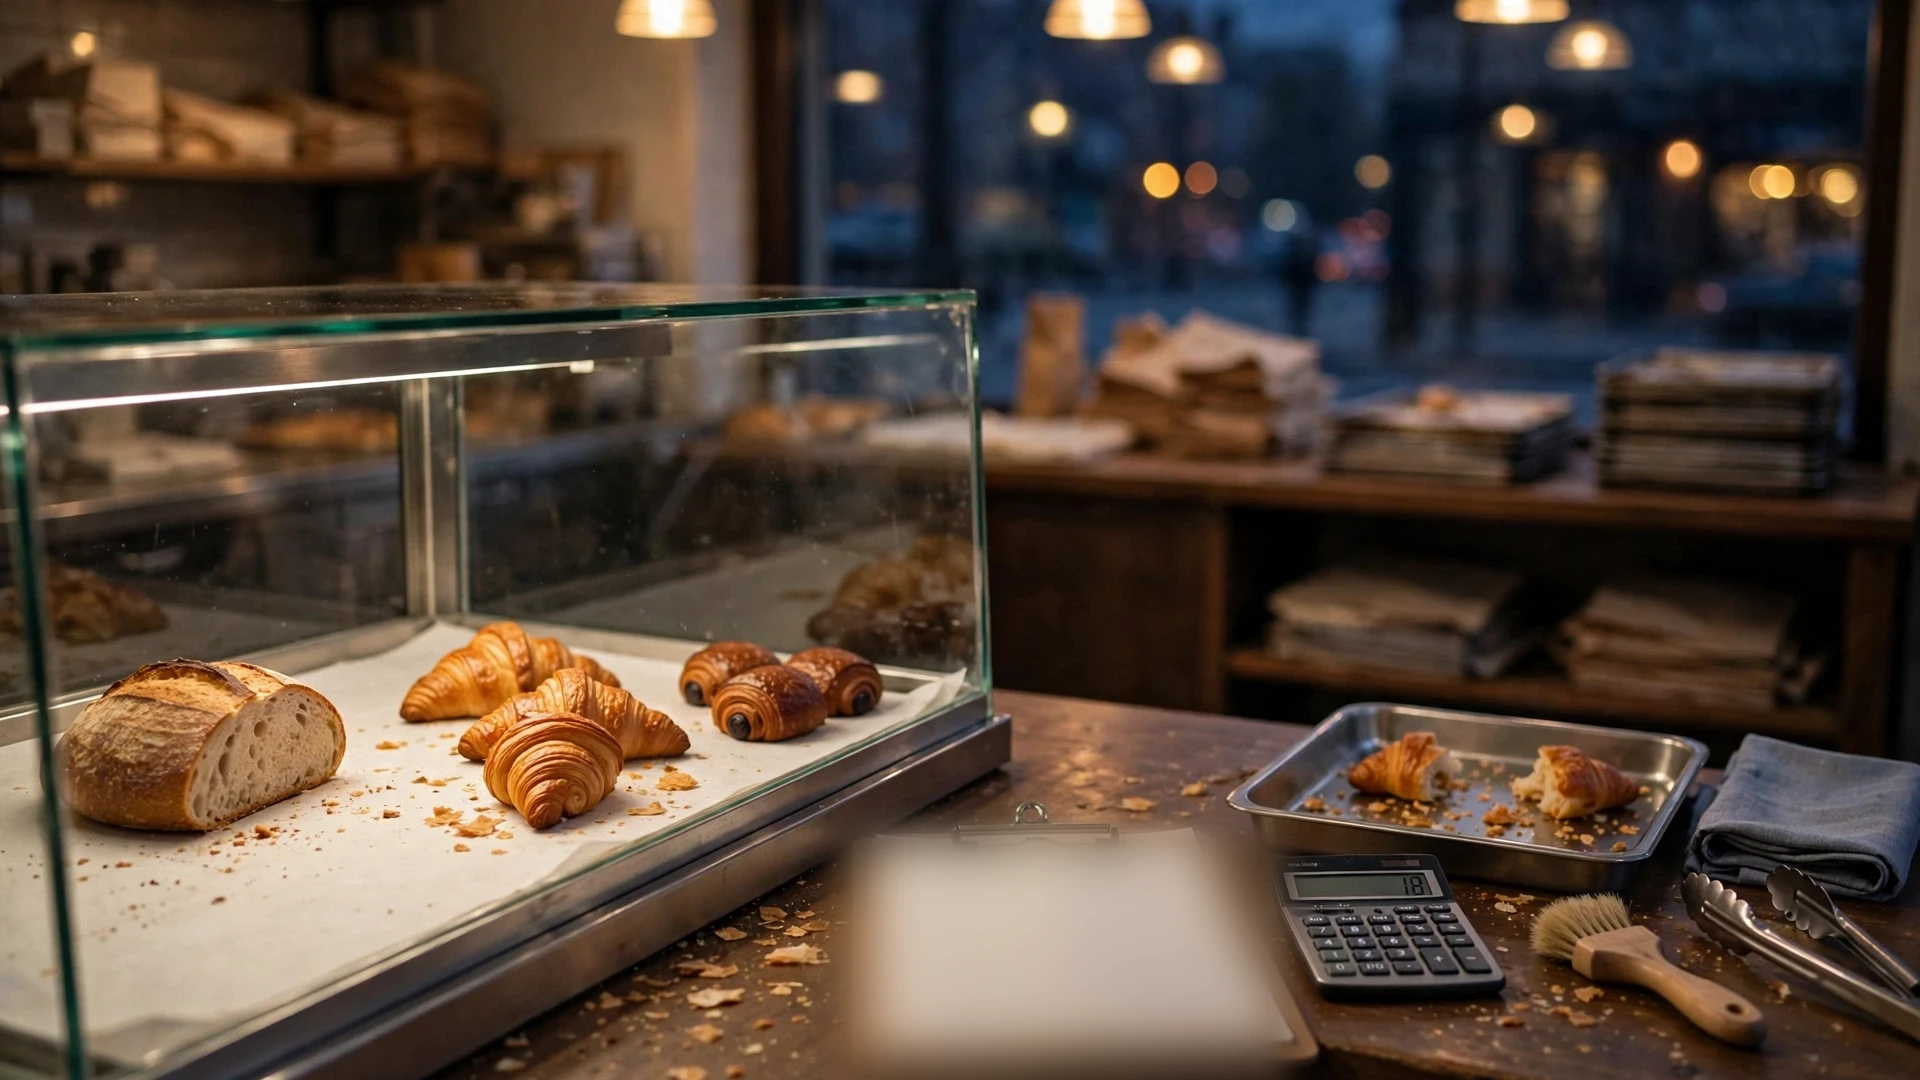
Step 1: Build Pars From Simple Sales History
You do not need forecasting software to get started. A POS item report and a simple leftover count are enough.
Use same-weekday averages
Pull unit sales for each item for the last four to six of the same weekday, so you compare Tuesdays with Tuesdays. Weekday patterns in bakeries are often very different, and averaging across the whole week hides those differences.
Correct for sellouts
Sales history only shows what you sold, not what customers wanted. If an item sold out at 11 a.m., true demand was higher than the recorded number. Ask staff to log sellout times. On those days, treat the recorded sales as a floor rather than the real demand figure.
The basic formula
Daily display par = average same-weekday sales × (1 + buffer %)
Keep buffers small for items with short freshness windows and slightly larger for items that hold well or can be carried over. Revisit the buffer whenever your leftover logs show a consistent pattern in either direction.
Step 2: Split Pars by Daypart
Most bakeries do not sell evenly across the day. Morning pastries peak early, while sandwiches and cookies often move later. Use hourly POS data to estimate what share of each item sells in each daypart, then load the case to match.
Daypart par = daily par × daypart share of sales
Also set a minimum presentation quantity. This is the smallest count that still looks intentional on the shelf, for example one full row or a single tray. Below that count, the item looks picked over and sales can slow.
These numbers are illustrative only. Your own shares should come from your own hourly data.
Step 3: Set Replenishment Triggers
Loading the full day’s quantity at open is the most common cause of tired afternoon product. Instead, stage backup product in the back and refill to a trigger point.
Refill trigger = (units sold per hour × restock time in hours) + minimum presentation quantity
Write the trigger on the case label or on a laminated card so anyone can act on it without asking a manager.
Step 4: Define Freshness Windows
Every item needs a written display window: how long it can stay out while still meeting your quality standard. Food-safety limits set by your health code and your own HACCP-style procedures always come first. Cream, custard, and other TCS (time/temperature control for safety) items must follow refrigeration and time rules, not quality preferences.
Within those limits, set quality windows by category. Laminated pastries usually decline fastest, muffins and quick breads hold longer, and many cookies and bars hold well. Label trays with the time they went out so staff can rotate first-in, first-out without guessing.
Step 5: Manage End-of-Day Sell-Through
Track sell-through for each item every day:
Sell-through % = units sold ÷ (units sold + units left at close)
Set a target for each item instead of one number for the whole case. High-margin items that drive traffic may justify a lower target so the display stays generous. Short-life items with expensive inputs deserve a higher target.
Tapering tactics for the last hours
- Set a “last bake” cutoff after which nothing new goes into the oven for display.
- Consolidate trays so fewer units still look intentional. Smaller platters, risers, or tighter groupings help.
- Stop refilling slow items once the last daypart begins, and let them sell down.
- Decide in advance which items are allowed to sell out before close.
Step 6: Write Carryover, Markdown, Donation, and Discard Rules
Leftover decisions made at closing by a tired shift lead are inconsistent and hard to measure. Decide them in advance, item by item.
Carryover
Only for items that meet day-two quality and safety standards. Label them, sell them first, and never carry over the same unit twice.
Markdown
Use a fixed time and a fixed discount or bundle. Ring markdowns under a separate POS button so you can track them.
Donation
Use a scheduled partner with agreed pickup times. Donate only safe, shelf-stable or properly held items.
Discard
Required for anything past its safety window or temperature limit. Always log the count and the reason.
In the U.S., the Bill Emerson Good Samaritan Food Donation Act provides liability protection for good-faith food donations. Confirm the details, and any state or local requirements, with your donation partner before you start. Markdown habits can also train customers to wait for discounts, so watch whether full-price sales shift later after you introduce them.
Daily Display Checklist
- Before open: confirm today’s daypart pars and load only the opening quantities.
- Label each tray with the time it went out.
- Check shelf counts against refill triggers at set intervals during peaks.
- Log sellout times for any item that runs out.
- At the last-daypart cutoff, stop refills on slow movers and consolidate trays.
- At close, count leftovers by item and record whether each unit was carried over, marked down, donated, or discarded.
- Enter the counts in your waste log the same day.
Manager Review Cadence
Daily: Scan leftover and sellout notes, and flag any item that is far outside its target.
Weekly: Recalculate same-weekday averages. Adjust pars only for items that show the same pattern for two or more weeks, so a single odd day does not reset your numbers.
Monthly: Review sell-through by item, markdown and discard cost against your food cost targets, and whether any items should be cut, resized, or moved to bake-to-order. Deeper yield and loss analysis belongs in the process outlined in our Bakery Yield and Waste Control article.
Event-driven: Adjust pars ahead of holidays, local events, weather shifts, and menu changes. When something unusual happens, note it in the log so it does not distort future averages.
Common Mistakes
- Filling the case to full-day par at open. This guarantees the oldest product is still on the shelf in the afternoon.
- Treating sellout days as true demand. This understates the par and repeats the shortage.
- Using one buffer for every item. Short-life items need tighter buffers than items that hold well.
- Leaving leftover decisions to closing staff. Without written rules, carryover and discard drift from shift to shift.
- Counting waste but never changing pars. A waste log only helps if someone reviews it and acts on it.
- Changing pars after one bad day. Weather or a local event can skew a single day. Wait for a pattern.
FAQ
How much history do I need for a new item?
Start with a conservative par based on a similar existing item. Track daily sales and sellout times, and recalculate once you have three to four same-weekday data points.
Should a display ever look empty at close?
Some items can be allowed to sell out, and that is a reasonable choice. Decide which ones ahead of time, and keep a few dependable items on the shelf so late customers still have options.
What if markdowns start replacing full-price sales?
Compare full-price sales in the hour before the markdown with the same hour before you started discounting. If late full-price sales drop, move the markdown later, reduce the discount, or switch to donation for those items.
Do I need special software?
No. A POS item report, a spreadsheet, and a consistent leftover log are enough to set and adjust pars. Inventory tools can speed up the process once your routine is in place.
Turn the Display Plan Into a Simple Control Sheet
A display plan becomes easier to manage when the team works from one short control sheet rather than several reports. Give each item one row with the opening quantity, daypart par, refill trigger, last-refill time, freshness window, closing count, and approved disposition. The sheet should be simple enough for a shift lead to update during service without leaving the floor for long.
Use the closing count to calculate a daily variance against the planned ending quantity. If you planned to finish with two cookies and actually finished with twelve, the ten-unit difference is a signal to review the afternoon par, not automatically proof that production was wrong. Check whether sales were unusually weak, a refill was made after the cutoff, or the case was loaded above its target.
For a broader inventory discipline, pair this routine with the site’s restaurant inventory count sheet guide and restaurant waste log process. The display sheet controls what reaches the customer-facing case; the inventory and waste records show the financial effect over time.
Use cost, not just units, when prioritizing fixes
Ten unsold low-cost rolls and ten unsold premium filled pastries should not receive the same management attention. Add an estimated unit food cost to the sheet and calculate closing exposure = unsold units × unit food cost. This is not a substitute for a full food-cost calculation, but it helps managers rank the items that deserve immediate par changes.
How to Test a Par Change Without Overcorrecting
Change one operating variable at a time whenever possible. If a muffin regularly leaves eight units at close, reduce the late-day display par or move the final refill cutoff earlier, then observe several comparable days. Avoid simultaneously changing the recipe size, selling price, display position, and par; if sales improve or waste falls, you will not know which change caused it.
Record the old par, new par, date of change, sellouts, closing leftovers, and any unusual event. A useful adjustment should reduce leftover exposure without creating repeated early sellouts. If sellouts begin well before the planned end of availability, restore part of the quantity rather than jumping all the way back to the old par.
This test-and-review method also prevents a common mistake: treating waste reduction as the only objective. A bakery can reach near-zero leftovers simply by underproducing, but that can sacrifice sales and customer choice. The better control point is the smallest practical leftover level that still supports the availability standard you have chosen for that item and daypart.
Summary
Set pars from same-weekday sales history and correct for sellouts. Split pars by daypart, refill to triggers, and taper the case before close. Write freshness windows and leftover rules in advance, log every unsold unit, and review the numbers on a fixed schedule. Small, data-backed adjustments made each week will reduce end-of-day waste more reliably than a single large overhaul.
Your Next Step
Pick your five highest-waste display items this week. Calculate their same-weekday averages and set daypart pars and refill triggers for each one. Then compare their leftover counts to the previous week.