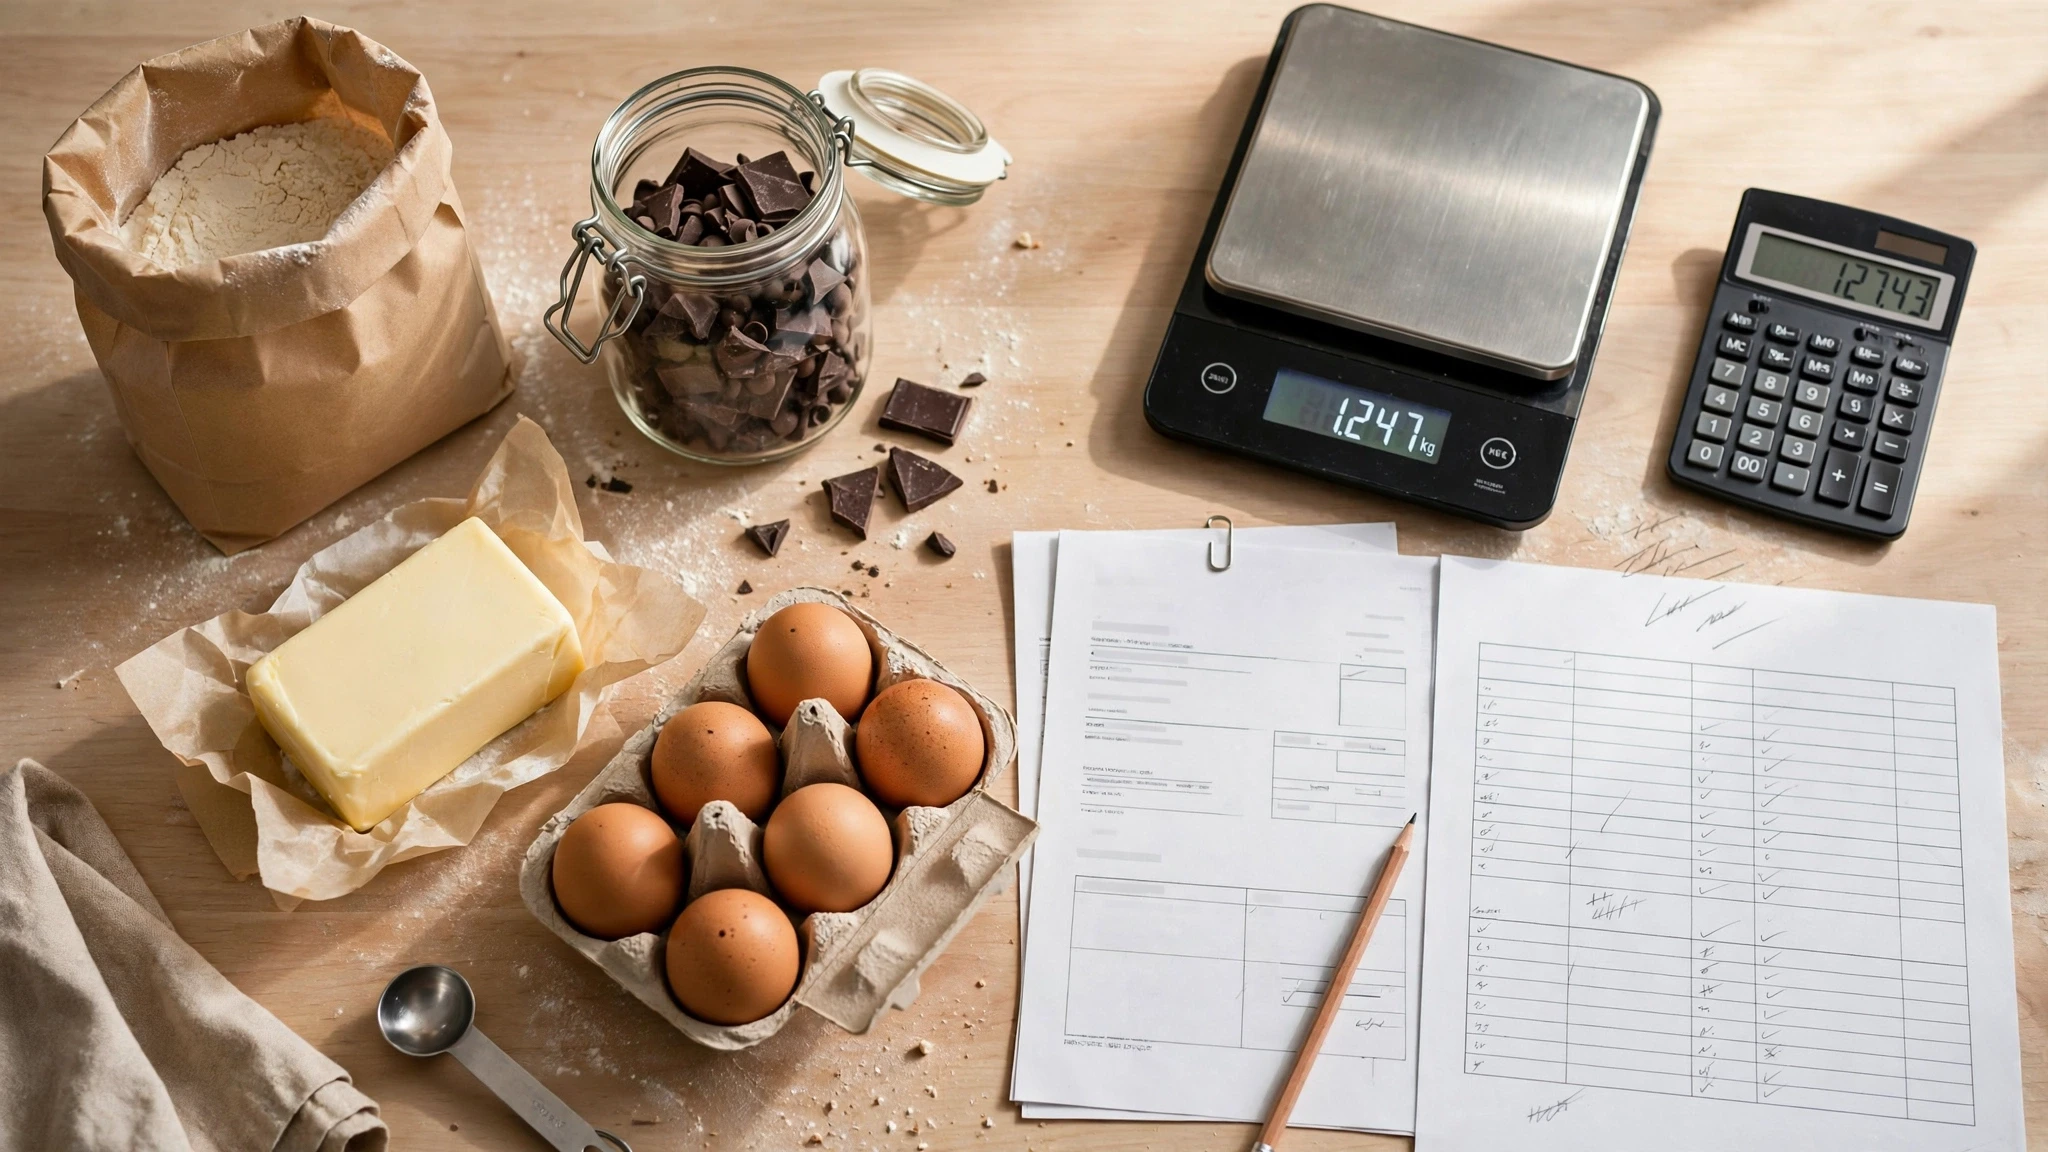
Bakery margins can change quickly even when selling prices stay the same because a small group of ingredients often drives a large share of recipe cost.
Butter increases, chocolate changes pack price, nuts move sharply, flour contracts reset, eggs fluctuate, and packaging changes at the same time. Management sees total food cost rise but cannot tell whether the problem is supplier price, recipe usage, yield or waste.
Ingredient cost variance separates those drivers so the bakery can take the right action.
Start with the major cost drivers
Rank ingredients by annual/monthly purchase spend and by importance inside high-volume recipes.
The highest-priority list may include flour, butter, eggs, cream, chocolate, nuts, fruit, cheese, oil and key packaging depending on the bakery.
Separate purchase-price variance from usage variance
Price variance asks: did the comparable unit cost change? Usage variance asks: did the bakery consume more or less physical product than expected for the production volume?
Do not mix them into one explanation.
Normalize units
Compare cost per kilogram, liter, piece or another controlled unit rather than case price.
A lower case price can hide a smaller pack, and a supplier substitution can change usable yield.
Build a cost-driver table
| Ingredient | Prior unit cost | Current unit cost | Change | Affected products |
| Butter | actual | actual | calculate | laminated dough, cakes, fillings |
| Chocolate | actual | actual | calculate | cookies, cakes, desserts |
| Flour | actual | actual | calculate | bread, pastry, cake |
| Eggs | actual | actual | calculate | multiple formulas |
Use actual invoice data; the table is a structure, not sample market pricing.
Measure purchase-price variance
A simple dollar estimate: (current unit price − prior/baseline unit price) × actual quantity purchased.
This shows how much of spend movement came from price if quantity is held to actual purchases.
Then check production volume
Higher ingredient spend may simply reflect more units sold/produced. Compare physical usage per finished unit, batch or standard production quantity.
Use theoretical recipe usage
If 1,000 croissants are produced and the standard recipe uses a known butter quantity per batch, theoretical butter usage can be calculated from actual production.
Compare theoretical with actual issues/purchases adjusted for inventory movement where the records support it.
Investigate yield-sensitive ingredients
Fruit, nuts, chocolate pieces or other ingredients can experience trim, melt, breakage, spillage or process loss.
Use yield/portion standards so ‘usage variance’ is not blamed on staff when the real standard is wrong.
Include supplier substitutions
A substitute can change unit price and recipe behavior at the same time. Re-test usable yield/recipe cost when the specification changes materially.
Track waste separately
Expired cream, burned nuts, spilled chocolate and overproduced filling are waste, not supplier price variance.
If waste is mixed into ‘ingredient cost went up,’ management cannot correct the right process.
Connect cost changes to recipe cost
High-impact ingredient changes should flow into recipe/sub-recipe costs on a defined update cadence.
A butter increase may affect dozens of products. Update the common sub-recipe or ingredient master instead of manually changing every product inconsistently.
Prioritize by exposure
A 30% price increase on a rarely used garnish may matter less than a 5% rise in butter used across thousands of units.
Exposure = unit-cost change × expected physical usage. Use this to rank management attention.
Set review triggers
The bakery can define internal triggers based on materiality: large unit-price move, repeated supplier substitutions, high monthly spend, or ingredient whose change materially shifts top product contribution.
These are internal decision thresholds, not industry benchmarks.
Review supplier alternatives carefully
A lower quote should be tested for specification, yield, quality, pack size, minimum order and delivery reliability.
Do not switch a major ingredient solely because the invoice price is lower.
Use menu/pricing response deliberately
If a sustained ingredient increase weakens a product’s contribution, management can consider price, portion, recipe, supplier, product mix or retirement.
Do not automatically pass every short-term commodity movement into guest price.
Example: butter price rises, usage also rises
Butter cost per kilogram increases 8%, but monthly butter spend rises 18% while pastry units rise only 3%.
The price variance explains part of the change. The remaining gap triggers a usage/yield investigation: batch scaling, laminating loss, portion, waste or inventory count.
Example: chocolate spend rises with no price change
Invoices show the same normalized chocolate cost. A new cookie promotion increased chocolate-heavy item mix and actual usage. The spend increase is demand/mix, not supplier inflation.
Monthly bakery cost review
- Top ingredients by spend.
- Largest unit-price changes.
- Largest dollar exposure from price change.
- Ingredients with actual usage above theoretical.
- Waste by high-cost ingredient.
- Recent substitutions/spec changes.
- Recipes most affected by current costs.
- Pricing/menu decisions requiring follow-up.
Common variance mistakes
Comparing case prices
Pack changes distort the conclusion.
Blaming supplier price for all spend growth
Volume, mix, waste and usage may be larger drivers.
Updating selling price without updating recipe cost
Management loses the ability to see the real contribution.
Switching suppliers without a yield test
Cheaper purchase cost can create higher usable cost.
Trying to track every minor ingredient equally
Management attention is diluted from major drivers.
Frequently asked questions
Which bakery ingredients should be monitored most closely?
Start with the ingredients that create the largest spend/exposure and those whose specification or yield materially affects high-volume products.
How often should ingredient costs be updated?
Use a regular cadence plus event-driven updates after material supplier/price changes. High-volatility inputs may need more frequent review.
Should packaging be included?
Track it separately or alongside ingredients depending on management reporting, especially where packaging is a meaningful unit cost.
How can a bakery tell price variance from waste?
Normalize supplier unit cost first, then compare expected/theoretical usage with actual physical usage and record waste separately.
Next action
Export the last two months of purchases and identify the ten ingredients with the highest dollar spend. Normalize each to a comparable unit and calculate the price change. Those ten lines will show where the bakery should investigate before adjusting dozens of product prices.
Related guides:
- Restaurant Ingredient Substitution Cost Control: Approve Replacements Without Losing Recipe Economics
- Restaurant Recipe Costing Spreadsheet Template: Fields, Formulas and Update Rules
- Actual vs Theoretical Food Cost: How to Find the Gap
- Bakery Yield and Waste Control: How to Reduce Dough, Bake and Display Loss