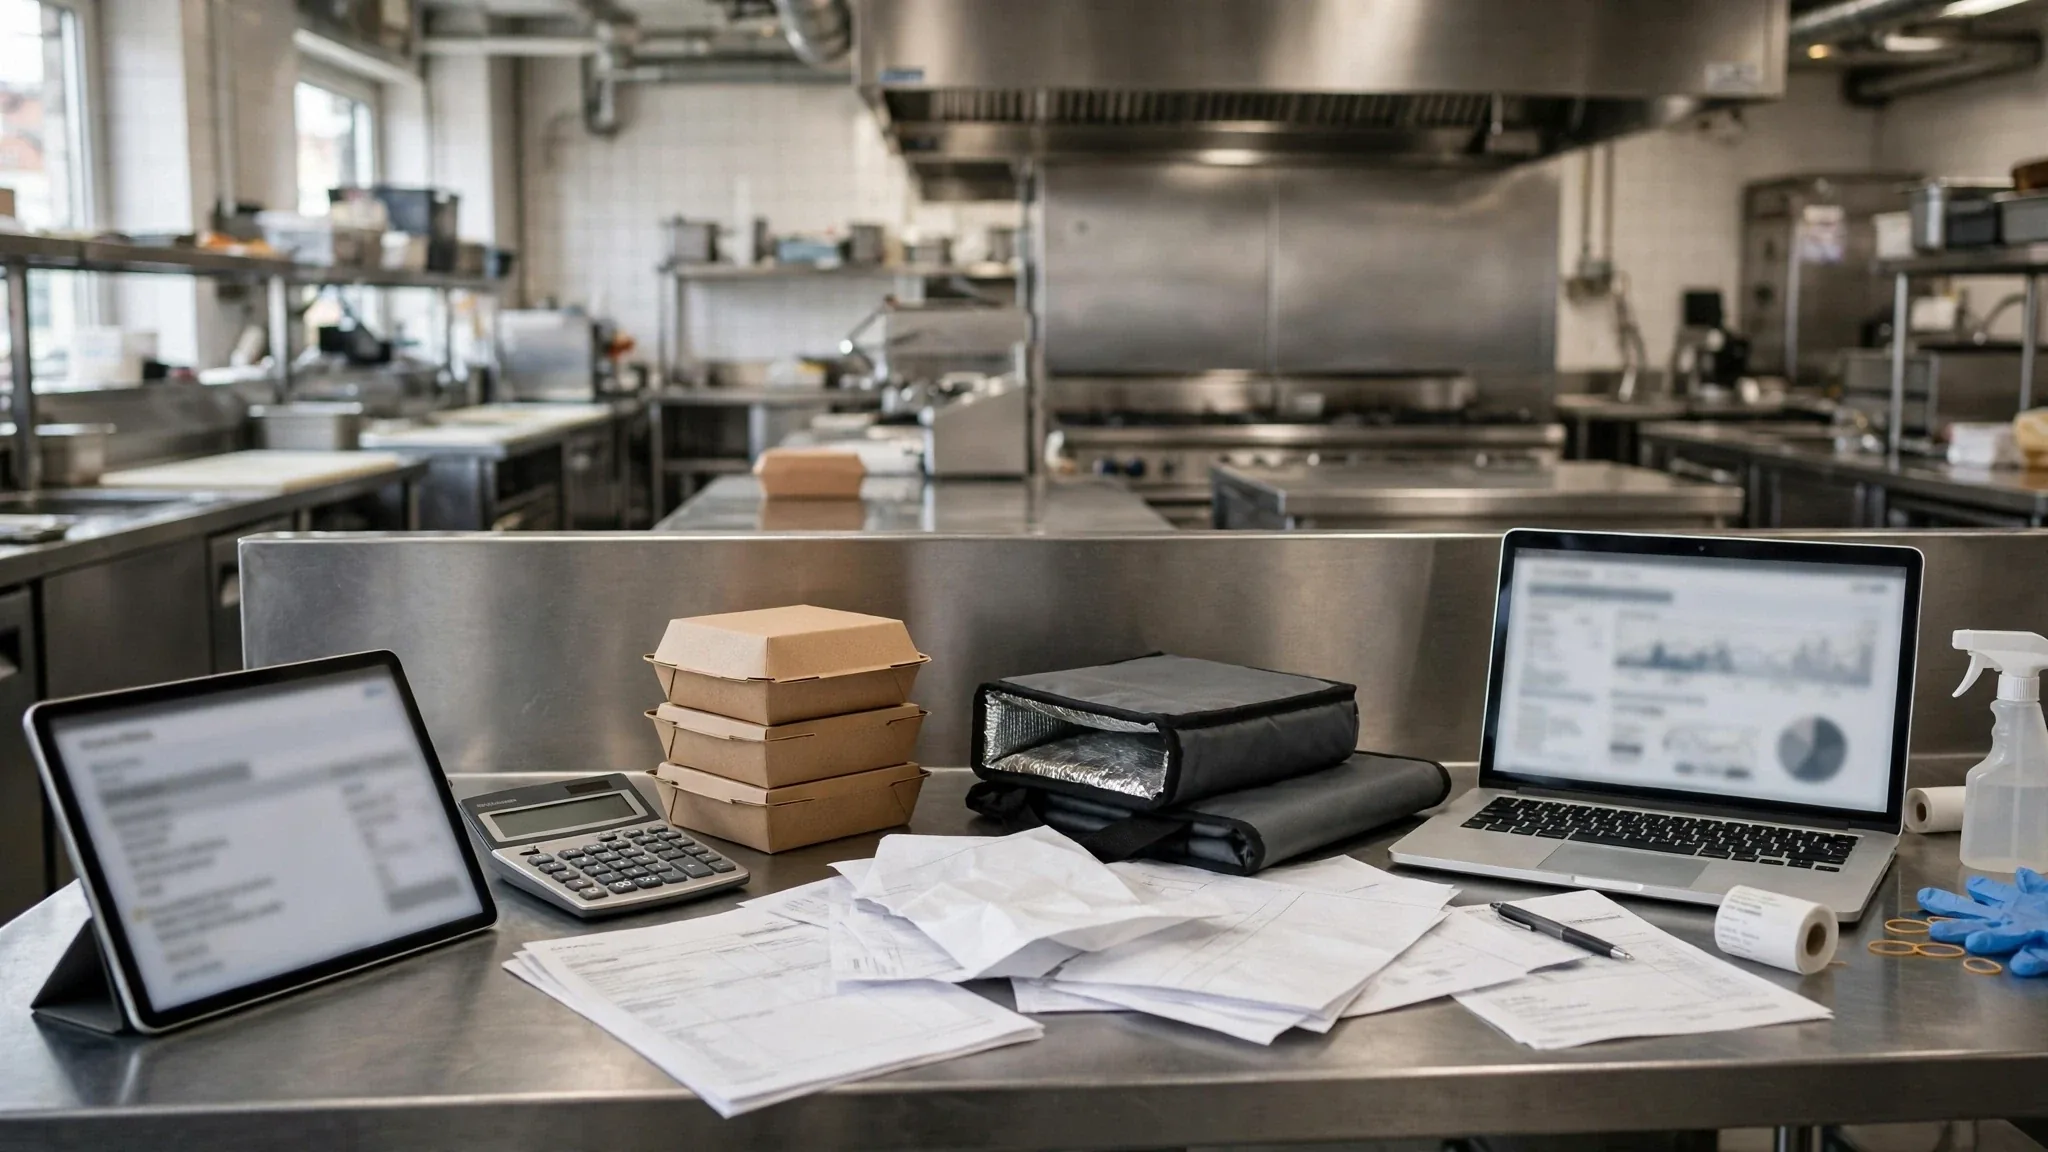
A delivery-only restaurant may show $50,000 in monthly app sales and still struggle to pay its owner. The reason is not mysterious: delivery commissions, packaging, food waste, paid promotion, refunds, base labor and occupancy compete for every dollar. The question how much does a ghost kitchen make? cannot be answered reliably with orders multiplied by menu price alone.
Quick answer: Ghost kitchen sales and owner income vary widely, and we did not find a sufficiently authoritative, consistently defined national ghost-kitchen-only median for owner earnings that would justify presenting one as fact. Instead, calculate contribution per order under your actual sales-channel mix and subtract monthly fixed operating costs. Below, transparent examples show how a ghost kitchen could lose money, break even or generate operating surplus at different volumes. These examples are not industry averages.
Check the investment alongside owner earnings: Use the free restaurant opening budget planner to estimate startup cash, working capital reserve and optional break-even orders before relying on an income scenario.
Revenue, marketplace payout, profit and take-home pay are different
Gross menu sales are the value of customer orders before relevant refunds and discounts. Net operating revenue should follow a consistent treatment of sales tax, discounts, refunds and delivery pass-throughs. Marketplace payout is the amount transferred by the platform after its adjustments and fees; it is not equivalent to profitability. Contribution margin is net revenue minus the costs that rise with each order. Operating profit subtracts the fixed costs of running the kitchen. Owner take-home income depends additionally on their salary arrangement, taxes, debt service and cash available after reinvestment.
A $30 basket can produce a $22.50 platform remittance before food and labor on a hypothetical 25%-commission contract; it does not produce $22.50 of profit. An owner drawing the full remittance would quickly lack enough cash to replace ingredients and pay staff.
Why delivery commissions make ghost kitchens different
DoorDash publicly lists U.S. Marketplace delivery plans with 15%, 25% and 30% commission rates on eligible plans. Contracts and promotional arrangements differ across services and merchants; check the exact rate on your payout statement. Pickup and direct ordering have distinct terms. DoorDash merchant pricing.
A 25% delivery fee consumes $7.50 of a $30 order before packaging and ingredients. Discount-funded campaigns can reduce the revenue remaining even further. One platform may deliver more orders at a higher commission, so the correct comparison is total contribution from truly additional, fulfillable orders, not just the nominal fee percentage.
Worked per-order profit bridge
The following is an illustrative marketplace order with $30 net menu revenue, not a claimed typical ghost-kitchen ticket or cost structure.
| One $30 order | Dollars | Share of revenue |
|---|---|---|
| Net revenue | $30.00 | 100.0% |
| Delivery marketplace fee (illustrative 25%) | −$7.50 | 25.0% |
| Food ingredients | −$9.00 | 30.0% |
| Containers, bags and labels | −$1.50 | 5.0% |
| Genuinely volume-driven labor | −$2.50 | 8.3% |
| Average variable refund/other allowance | −$1.00 | 3.3% |
| Contribution after variable costs | $8.50 | 28.3% |
Assumptions: no separately charged processing fee on the same order, no additional order-level sponsored-listing charge, and no sales tax or pass-through tip inside the $30. If your vendor charges these separately, your contribution is lower. If actual food cost or commission is below the example, contribution is higher. Never use this table as your own profit statement without replacing the inputs.
Three monthly ghost kitchen earnings scenarios
Assume $12,500 monthly fixed costs, including rent, utilities, base staffing and subscriptions but excluding owner pay, debt principal, income taxes and major equipment purchases. Each month has 30 order-taking days. Per-order contribution stays $8.50 only as a simplified planning assumption.
| Volume | Slow month | Base month | Strong month |
|---|---|---|---|
| Orders per day | 40 | 67 | 80 |
| Orders per month | 1,200 | 2,010 | 2,400 |
| Menu sales at $30/order | $36,000 | $60,300 | $72,000 |
| Contribution at $8.50/order | $10,200 | $17,085 | $20,400 |
| Monthly fixed costs | $12,500 | $12,500 | $12,500 |
| Modeled operating result | −$2,300 | $4,585 | $7,900 |
These are potential results before owner compensation and exclusions. The base month’s $60,300 in sales does not mean the operator pockets $60,300, or even the modeled $4,585. Promotional costs not included in the example, new staffing tiers, financing and taxes may materially change the outcome. Sales volume also rarely remains perfectly consistent across all months.
Find your break-even order count first
Break-even orders per month = monthly fixed costs ÷ contribution per order. Here that is $12,500 ÷ $8.50 = 1,471 orders when rounded up to a full order. Over 30 days, that is roughly 50 orders a day. A target of 50 daily orders is meaningless unless the kitchen can fulfill them at the assumed average value and cost structure.
If the owner also needs $4,000 per month for their working role, model it as an additional operating cost rather than silently treating all existing surplus as compensation. The revised break-even becomes ($12,500 + $4,000) ÷ $8.50 = 1,942 orders per month, or about 65 a day. This simple calculation ignores financing and income tax and assumes capacity is sufficient without another paid shift. Use the restaurant break-even sales calculator to test alternative contribution ratios.
The biggest mistake: counting all app orders as incremental
Suppose a virtual brand sells 100 orders through a sponsored listing in one week. Without a baseline, you cannot know whether 100 new customers appeared. Some orders may come from existing customers who would have bought anyway; some may displace another brand operating in the same kitchen. If a campaign merely moves a guest from direct ordering to a higher-fee marketplace, reported marketplace revenue rises while total company contribution can fall.
Measure channel performance by order IDs, refunds, net sales, platform fees, packaging, food cost and the actual deposit. Compare similar dayparts and promotional periods. Where practical, test with a capped budget and a pre-defined stop rule. The restaurant advertising budget and ROI guide explains the difference between attributed orders and genuine added demand.
Compare marketplace and direct orders correctly
A direct-order channel may have lower marketplace commission but still requires paid customer acquisition, checkout processing, website maintenance, delivery operations and support. If third-party couriers fulfill direct orders, the operator may still pay a delivery-service fee. A fair comparison allocates the costs that actually change with channel, not the same flat percentage to every order.
Illustrative comparison: a $30 marketplace order contributes $8.50 in the example above. Suppose a direct order avoids the $7.50 commission but adds $1.20 of processing, $4.50 direct courier dispatch and $1.00 variable customer-acquisition support. Its contribution would be $9.30 if all other order costs were identical: $8.50 + $7.50 − $1.20 − $4.50 − $1.00. The direct order wins by $0.80 here, not $7.50. If the customer collects the order, the equation changes again.
The result cannot be generalized: the operator should use real settled data. Check the online ordering integration guide for operational costs and handoffs that can be overlooked.
Measure throughput at peak hour, not only daily orders
A kitchen that averages 67 daily orders may receive half of them during a short dinner rush. The bottleneck could be a single fryer, grill, cold-prep bench or packaging table. Measure orders per 15-minute interval, average preparation time, courier waiting, wrong-item remakes and food holding time. A profitable order on paper loses its value when labor expands, refunds rise or repeat customers disappear because of late delivery.
Estimate capacity for each critical station at the forecast peak and test it before a large promotion. A constrained kitchen may need a smaller menu, redesigned mise en place or a tighter delivery radius more than another virtual brand. See kitchen ticket-time control for spotting preventable delays.
Product mix: which dishes actually make money?
Every item needs a contribution calculation that includes platform fees and the packaging actually used. A $12 side dish on a separate order is not economically equivalent to the same side added to an order already going out. Bundles can raise the basket but also change food, prep, packaging and discount costs.
Track unit sales by menu item and by channel, price after discount, recipe cost, packaging, packaging failure rate, refunds and station time. If a popular item takes longer than its contribution justifies, simplify the recipe or revise the menu before simply raising advertising spend. The delivery-menu profitability guide offers a related operational framework.
Can a ghost kitchen owner make passive income?
Not merely because guests do not enter a dining room. Somebody must approve purchasing, review food safety, watch inventory, handle staff absence, maintain platform menus, reconcile payouts, investigate complaints and manage delivery relationships. A kitchen whose owner does these tasks without wages appears more profitable than one with paid management, even if the cash generation is identical before paying for that labor.
Create two models. In the owner-operated model, show owner hours and fair compensation explicitly. In the managed model, price in a qualified supervisor and any extra administration. Subtract financing and necessary reinvestment before discussing distributable cash. Never describe owner cash withdrawals as profit automatically.
Weekly dashboard for a delivery-only brand
A useful weekly review keeps these numbers connected:
- Gross orders, fulfilled orders and canceled orders by channel.
- Net menu revenue after refunds and discounts.
- Effective marketplace commission and sponsored-listing costs.
- Food and packaging cost per fulfilled order.
- Contribution per order and total contribution by channel.
- Ticket time, refund reason and customer complaints.
- Platform receivables, settlements and cash balance.
- Base staffing cost, utilization and owner working hours.
Use the delivery payout reconciliation and daily sales management review to keep recorded sales and bank deposits connected. In particular, do not double-count a platform fee as both a deduction from reported sales and a separate operating cost unless the revenue-recognition method calls for it.
Frequent reasons projected profits do not materialize
Launching on discounts. Introductory free-delivery offers create demand that disappears when the incentive expires. Run a full-price scenario.
Omitting waste. Some products cannot be economically held for a future order. Ingredient spoilage and unsold mise en place reduce contribution.
Using a flat commission percentage for every order. Platforms, subscription plans and direct pickup may have different fee structures; promotional charges further complicate payouts.
Calling all labor fixed. Order surges may require temporary cooks and packers, while very low volume still carries guaranteed wages.
Ignoring customer replacement. One-time app exposure is not a loyal customer base. Acquisition costs can grow as nearby competitors advertise.
Assuming many brands equal many independent customer pools. Virtual brands can cannibalize each other, consume the same station capacity and create menu-management errors.
Frequently asked questions
What is a typical ghost kitchen profit margin?
There is no single defensible universal figure across delivery-only concepts and accounting methods. Compare contribution and fully loaded operating profit using the actual mix of marketplace and direct orders; published vendor estimates are not representative audited national results.
How much does a ghost kitchen make per month?
Monthly revenue = fulfilled net orders × average net order value. The example here runs from $36,000 to $72,000 in sales under chosen volume assumptions, but those are illustrative, not observed market averages. Operating results vary much more sharply than revenue.
What is the fastest way to raise profit?
First inspect whether representative menu orders generate positive contribution after food, platform fees, packaging and fulfillable labor. Then improve item mix, error rates, staffing and channel allocation. Buying more advertising for negative-contribution products increases losses.
Does $10,000 in app payouts mean a $10,000 profit?
No. The payout is a settlement after selected platform adjustments and before many costs paid separately by the business. Reconcile it against inventory, payroll, rent, cash and taxes.
Can I add another brand with almost no cost?
Sometimes it uses existing infrastructure, but added menus, products, packaging, order errors, training, ads and peak-hour demand are real incremental costs. Stress-test capacity and cannibalization first.
Final decision checklist
- ☐ Build contribution per order for every major sales channel.
- ☐ Separate fee-free promotions from steady-state commission rates.
- ☐ Test at least three daily volume scenarios with peak-hour capacity limits.
- ☐ Include replacement labor for owner duties.
- ☐ Reconcile platform payouts with sales and refunds weekly.
- ☐ Plan financing, income tax, capital replacement and cash reserves separately.
- ☐ Compare buying customer demand with contribution and repeat-order evidence.
Bottom line: A ghost kitchen can generate meaningful sales without a dining room, but owner income depends on per-order contribution, reliable order throughput and disciplined fixed costs. Begin with transparent order-level economics, not broad ghost-kitchen income claims. The companion ghost kitchen startup costs guide covers the investment side. If you also serve walk-in pickup customers from a storefront, the takeout restaurant earnings guide runs the same order-level math for that format.
Research sources
- DoorDash: Merchant Pricing — published U.S. Marketplace delivery commission tiers.
- DoorDash: How Marketplace Works — channel terms and tiers.
- SBA: Break-even planning — fixed costs and contribution relationship.
- UpMenu: Ghost Kitchen Business Models — models, capacity and concept context.
Compare other food business models: Explore the startup costs and owner earnings guide library to compare the investment required and potential owner income across coffee shops, food trucks, catering businesses, bakeries, ghost kitchens and pizza shops.
Editorial note: No authoritative ghost-kitchen-only national median owner earnings is asserted. All numerical examples are transparent hypothetical operating scenarios. Reviewed October 21, 2026.